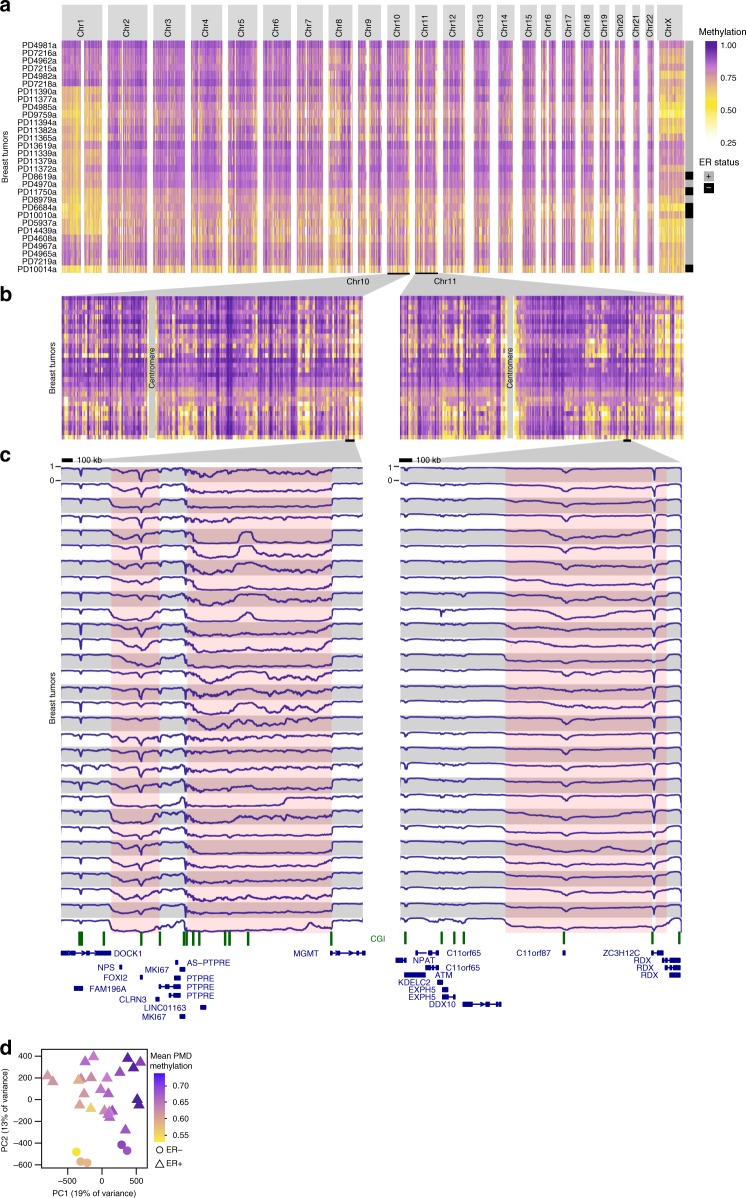
Fig. 1.
Visualization of inter-tumor variation at genome-wide scale. a Genome-wide and b chromosome-wide maps of WGBS DNA methylation profiles from 30 breast tumor samples. Mean methylation is displayed in consecutive tiles of 10 kb (see Methods section). Ordering of tumor samples is according clustering of the tiled profiles. c WGBS DNA methylation visualization at megabase-scale. Pink coloring indicates common methylation loss (PMDs), although tumor-specific PMD borders vary. A scale bar (100 kb) is shown at the top of each panel. CpG islands are indicated in green. d Principal component analysis of WGBS DNA methylation profiles (see Methods section). Each tumor sample is represented with its estrogen-receptor (ER) status (point shape) and mean PMD methylation (point color)

