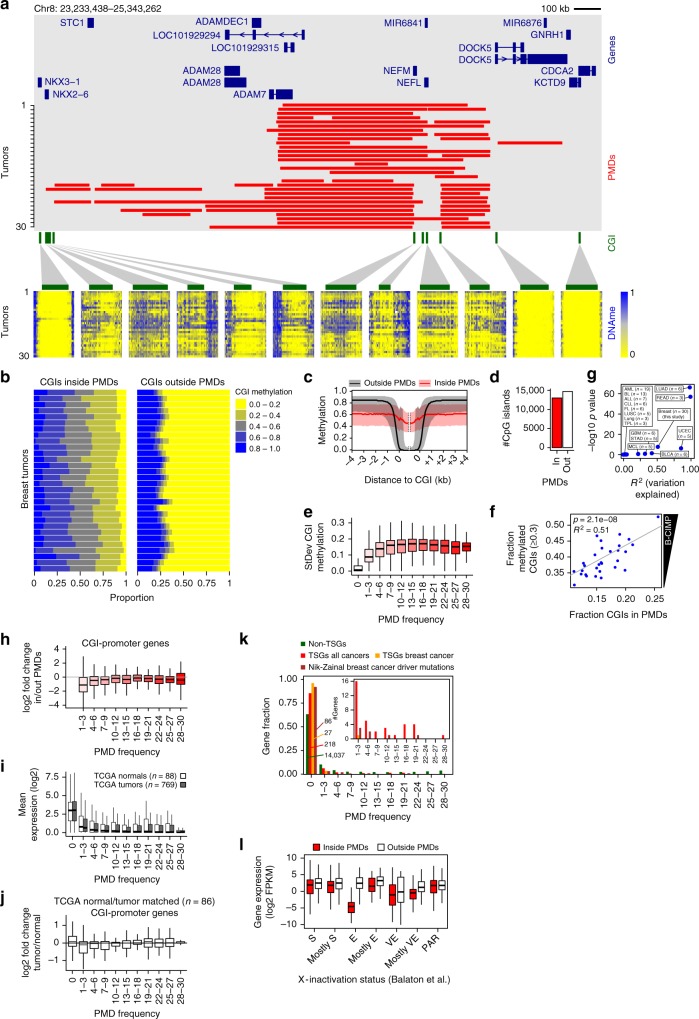
Fig. 3.
CpG island hypermethylation inside PMDs. a Representative 2.1-Mb genomic region. Red bars, PMDs for each tumor; below, CGI methylation per tumor (same ordering). Green bars, CGIs. b CGI methylation as the fraction of all CGIs (x-axis). Horizontal bars represent individual tumors. c Methylation over CGIs inside/outside PMDs, averaged over all 30 tumors. Black/red lines, median; gray/pink area, 1st and 3rd quartiles. d CGI counts inside and outside of breast cancer PMDs. “in”, CGIs inside PMDs in at least one tumor sample. e Variation of CGI methylation (standard deviation) as a function of PMD frequency. f Regression analysis of B-CIMP (y-axis) as a function of the fraction CGIs inside PMDs (x-axis). B-CIMP: the genome-wide fraction of hypermethylated CGIs (>30% methylation). g Summary of regression analyses as in (F), for additional cancer types. n, the number of samples for each type. For abbreviations of cancer type names, see Fig. 4b. h Expression change of CGI-promoter genes inside vs. outside of PMDs, as a function of PMD frequency. i Gene expression as a function of PMD frequency in TCGA breast cancer data. PMD frequency was derived from our own methylation data. j Expression change of CGI-promoter genes as a function of PMD frequency in matched breast cancer tumor/normal pairs (TCGA). PMD frequency was derived from our own methylation data. k Tumor-suppressor genes (TSGs) are excluded from PMDs. PMD frequency was determined for each TSG and the resulting distribution was plotted. Main plot, relative distribution; inset, absolute gene count. “Non-TSGs”, genes not annotated as TSGs; “TSGs all cancers”, genes annotated as TSGs regardless of cancer type; “TSGs breast cancer”, genes annotated as TSG in breast cancer; “Nik-Zainal breast cancer driver mutations”, genes with driver mutations in breast cancer15. l Expression of X-linked genes when inside or outside PMDs. Genes were grouped according X-inactivation status (E, escape; S, subject to XCI; VE, variably escaping; PAR, pseudoautosomal region)41. All boxplots in this figure represent the median and 25th and 75th percentiles, whiskers 1.5 times the interquartile range, outliers are not shown

