Fig. 2.
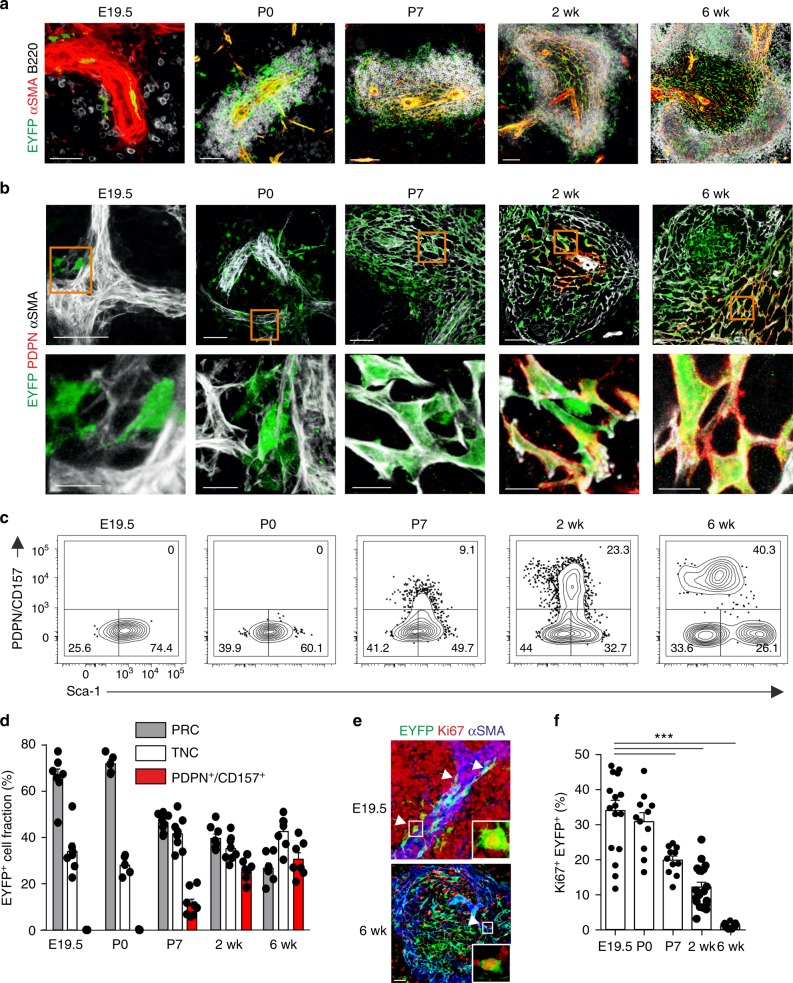
Reticular cell subset differentiation during splenic white pulp development. a, b Time course analysis of EYFP-expressing cells in spleens from Ccl19-iEYFP mice harvested at the indicated stages. Confocal microscopic analysis depicting αSMA+ myofibroblasts (a) and PDPN+ TRC (b). Boxes in (b) indicate magnified regions in the lower row. Microscopy data are representative for two or more independent experiments (n ≥ 4 mice per group). c, d Flow cytometric analysis of CD45−TER119−EYFP+ cells using antibodies against PDPN, CD157 and Sca-1. Values from one representative experiment indicate percentage of the respective population shown in (c) and cumulated values for proportions of reticular cell subsets shown in (d) (n > 5 mice per group from two to three independent experiments, mean ± SEM). e, f Assessment of cellular proliferation using Ki67 staining in spleens of Ccl19-iEYFP mice at the indicated age with representative section in (e) and quantification of the proportion of Ki67 expression in EYFP+ cells (f) (n > 4 mice per group from three independent experiments, mean ± SEM). Statistical analysis was performed using a one-way ANOVA with Tukey’s post test. Source data are provided as Source Data file

