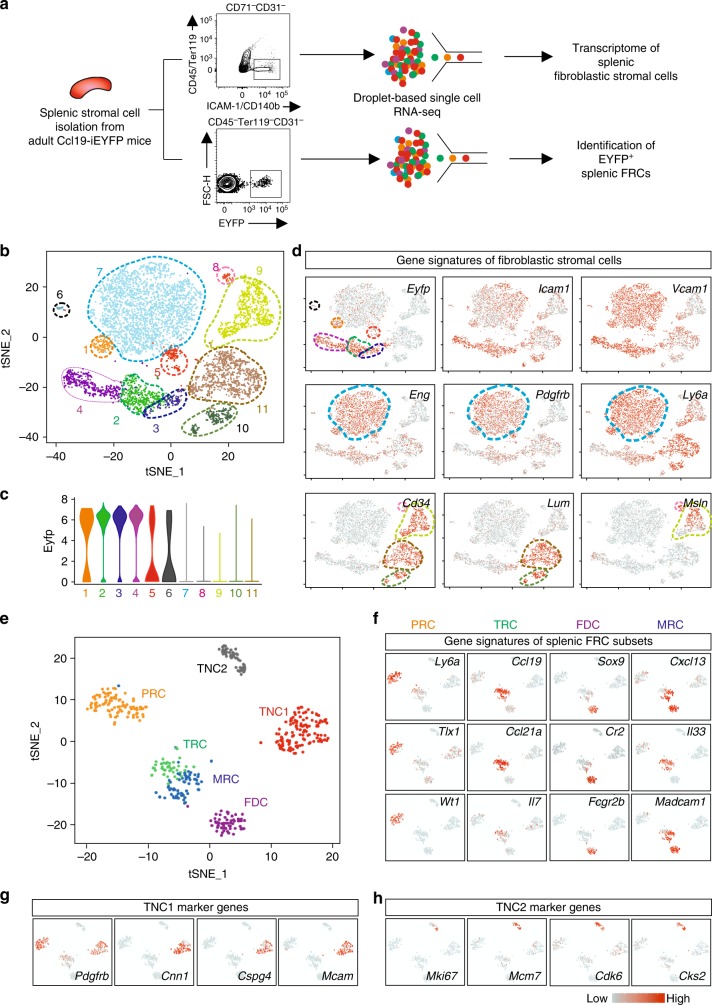
Fig. 5.
Transcriptomic analysis of splenic white pulp reticular cells. a Schematic depiction of the droplet-based scRNA-seq workflow. b tSNE map of sorted splenic fibroblastic stromal cells from adult Ccl19-iEYFP mice. c Violin plots of Eyfp expression in different clusters based on the scRNA-seq analysis. d Gene signatures of distinct splenic reticular cell subsets. The density of the red color represents the expression level of the genes. e tSNE map of sorted EYFP+ cells from adult Ccl19-iEYFP mice demarcated with the reticular cell populations. scRNA-seq data are pooled from two independent experiments. f–h Gene signatures of distinct splenic reticular cell subsets acquired from scRNA-seq analysis. The density of the red color represents the expression level of the genes

