Fig. 4.
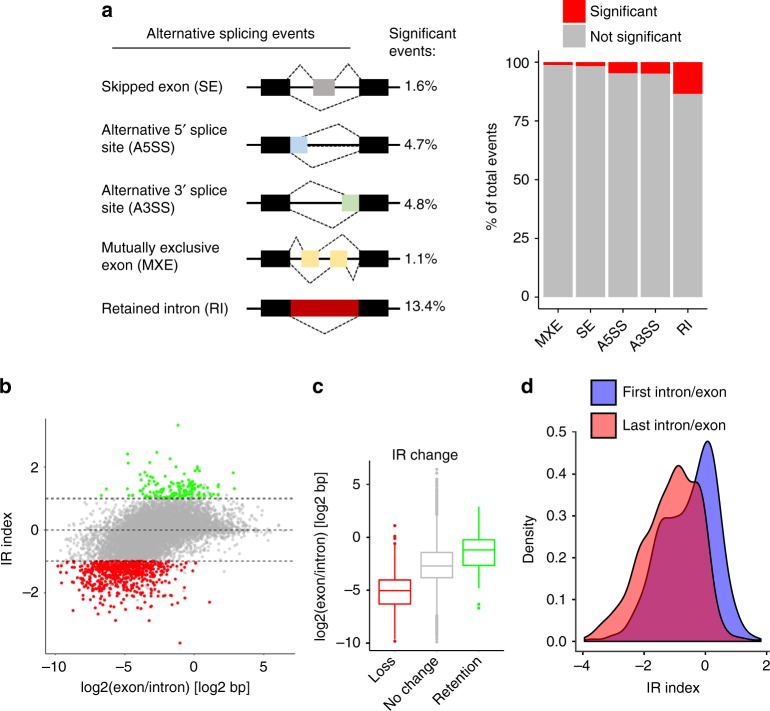
CDK12/13 inhibition results in minimal splicing alterations. a Diagrammatic representation (left) and bar plot of splicing events (right) observed in TT-seq analysis of NB cells treated with THZ531 (400 nM) for 2 h. b Scatterplot of intron retention index (IR index) vs. the ratio of exon and intron lengths in log2 scale. Genes with an IR index >1 or ≤1 display intron retention and loss respectively (adjusted p < 0.05, Fisher’s exact test). c Box plot illustrating the length distributions of genes that display intron loss or retention. The center line indicates the median for each data set. d Density plots illustrating the contributions of the proximal (first intron/exon) and distal (last intron/exon) gene regions in calculation of the IR index. Comparison of IR index distribution between proximal and distal intron/exon pairs (p = 0, Kolmogorov-Smirnov test)

