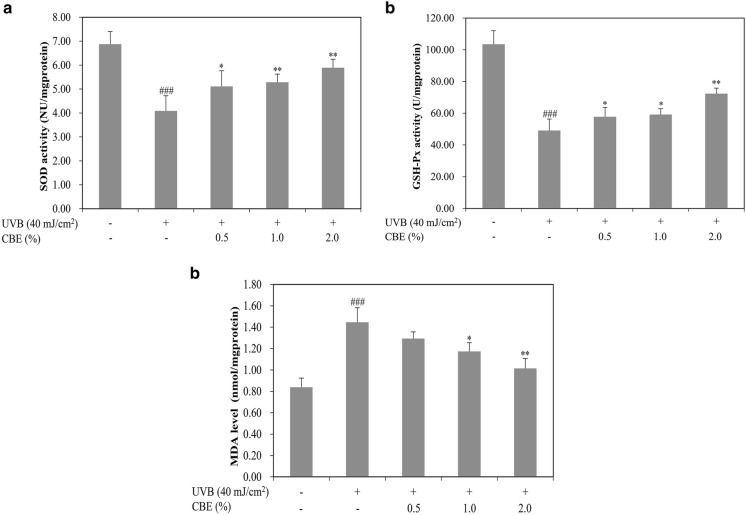
Fig. 3.
Effects of CBE on SOD and GSH-Px activities and MDA content in UVB-induced HaCaT cells. Cells were treated with different concentrations of CBE (0.5, 1.0, and 2.0%) for 24 h and then irradiated with UVB (40 mJ/cm2). SOD activity (a), GSH-Px activity (b) and MDA content (c) were measured using relevant kits. Values are shown as the mean ± SD (n = 3). ###P < 0.001 versus the control; *P < 0.05, and **P < 0.01 versus the UVB-alone group

