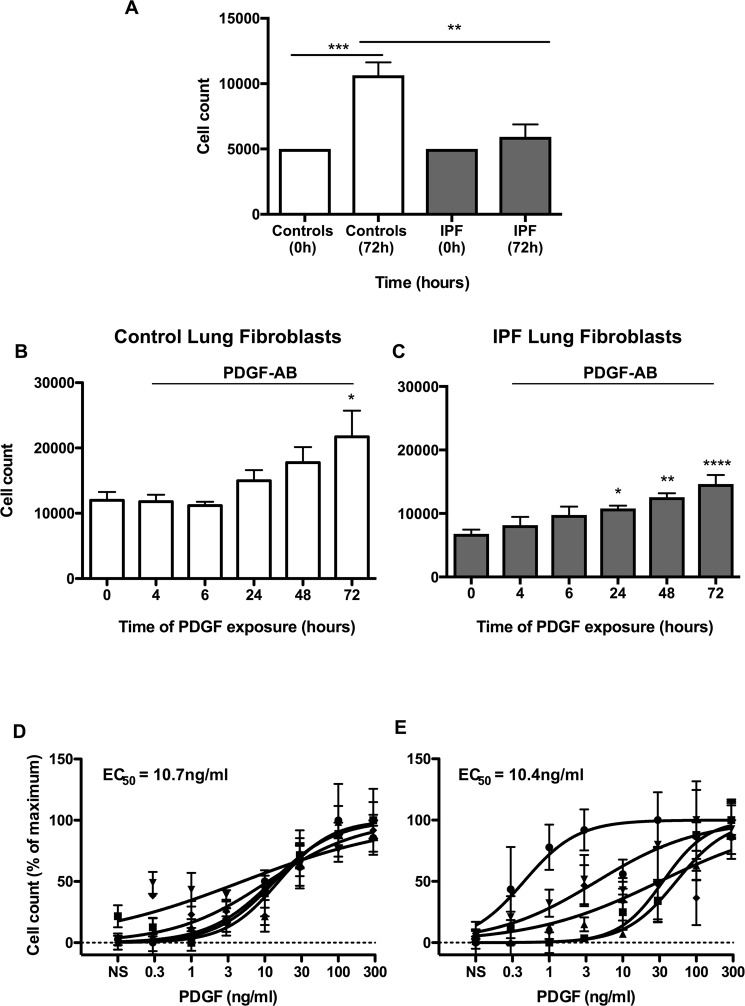
Figure 2.
Non-stimulated IPF lung fibroblasts show a reduced proliferative response. Proliferation in non-stimulated control (white) and IPF fibroblasts (grey) was measured 72 h using cell count (A). Time course of proliferation in PDGF-stimulated (from control (B) and IPF (C) patients). Proliferation in control (D) and IPF (E) fibroblasts at 72 h following exposure to the indicated PDGF concentrations. Data represents the mean +/− SEM of five individuals. Statistical significance was performed using 1-way analysis of variance (ANOVA) with a Dunnett’s or Tukey’s test for time courses (A–C) where *p < 0.05, **p < 0.01 and ****p < 0.0001. The logEC50 for each individual was determined in GraphPad Prism and comparison between control and IPF groups was performed using a unpaired t-test. The EC50 was calculated from the mean logEC50 values.

