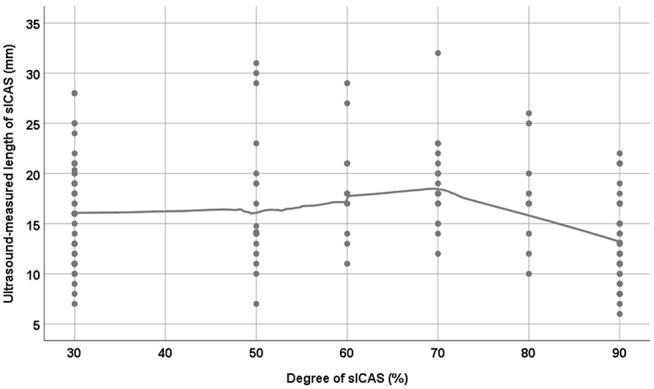
Figure 4.

The relationship between the degree and length of sICAS (symptomatic internal carotid artery stenosis). LOESS regression with a smoothing parameter of 0.6 was used to produce the curve. N.b. For technical reasons, 30% was used to represent 20–40% internal carotid stenosis; the NASCET hemodynamic criteria does not differentiate between 20, 30, and 40% internal carotid stenosis.
