
Figure 3.
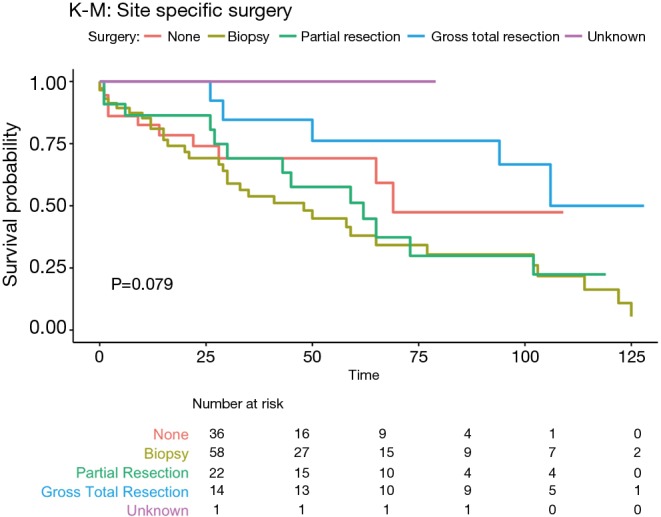
Kaplan-Meier survival analysis of surgical intervention demonstrating survival probability against time (in months). Number at risk table for surgical intervention can also be seen below the plot.
Official websites use .gov
A
.gov website belongs to an official
government organization in the United States.
Secure .gov websites use HTTPS
A lock (
) or https:// means you've safely
connected to the .gov website. Share sensitive
information only on official, secure websites.
Kaplan-Meier survival analysis of surgical intervention demonstrating survival probability against time (in months). Number at risk table for surgical intervention can also be seen below the plot.