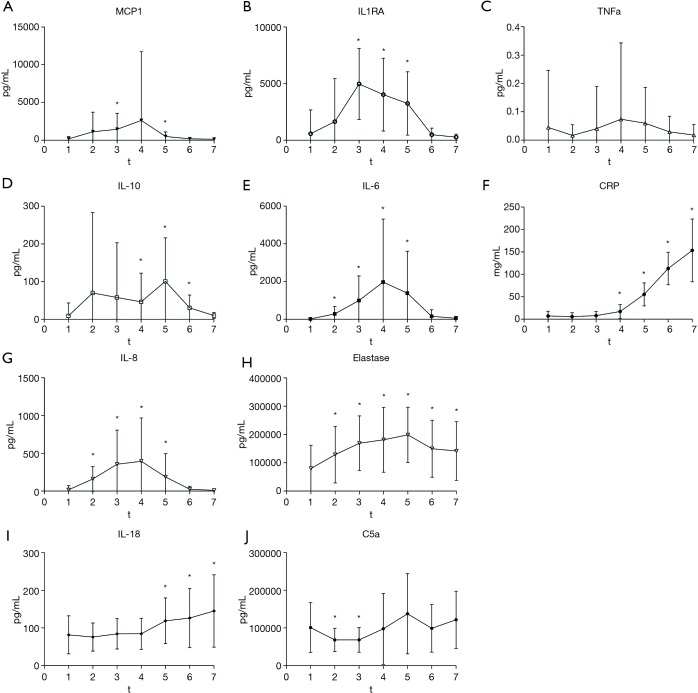
Figure 4.
Cytokine response. In (A,C,E,G,I) the pro-inflammatory proteins are shown. In (B,D,F,H,J) the anti-inflammatory cytokines, the acute phase proteins and the degradation products are shown. t1, after placement of radial artery catheter; t2, just before initiation of hyperthermic phase; t3, after thirty minutes of hyperthermia; t4, at the end of the hyperthermic phase; t5, at arrival at the ICU; t6, after 12-hour ICU; t7, after 24-hour ICU. *, significantly different from t1.

