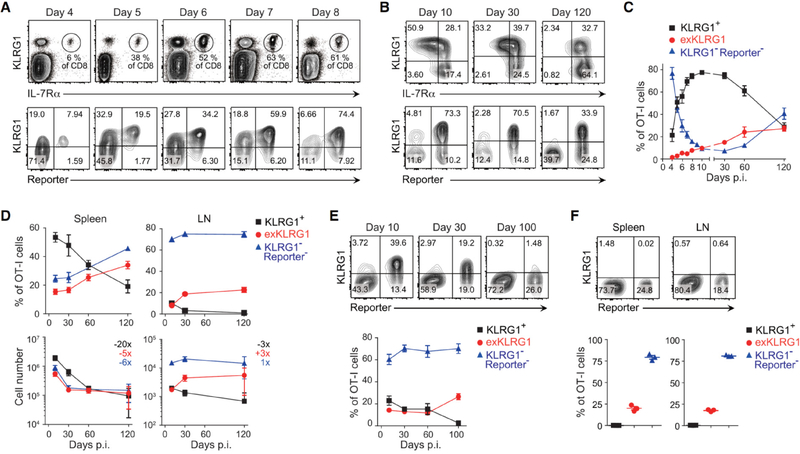
Figure 1. Effector CD8+ T Cells Lose KLRG1 Expression and Differentiate into Long-Lived Memory Cells.
(A and B) Expression of KLRG1 and fate mapping in effector OT-I cells in the blood following LM infection.
(C) Frequency of KLRG1+, exKLRG1 and KLRG1− Reporter− cells among OT-I cells in the blood up to 120 days p.i. with LM.
(D) Percentage (top) and number (bottom) of OT-I cell subsets in the spleen and LN following LM infection. The numbers indicate fold difference in cell number between days 10 and 120.
(E) Frequency of KLRG1+, exKLRG1 and KLRG1− Reporter− cells among OT-I cells in the blood up to 100 days p.i. with VSV.
(F) Percentage of KLRG1+, exKLRG1 and KLRG1− Reporter− cells among OT-I cells in the spleen and LN 100 days p.i. with VSV.
Mean ± SEM are shown. Data are pooled from 2–4 independent experiments with 4–12 (C) or 3–12 mice per time point (D), or are representative of 2–3 independent experiments with 3–5 mice per time point (A, E, F). See also Figure S1 and S2.

