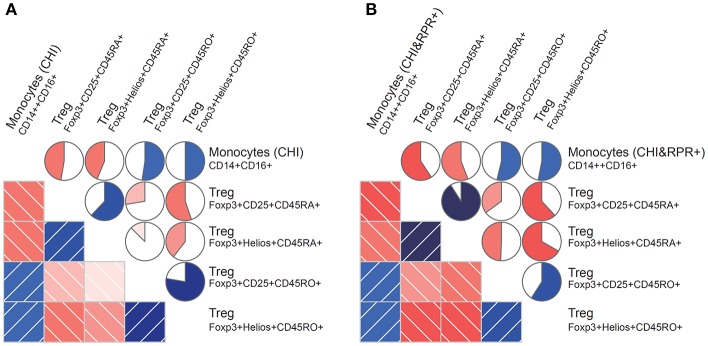
Figure 3.
Correlations between monocyte subsets and Foxp3+ Tregs during T. pallidum/HIV-1 co-infection. Monocyte subset frequencies were correlated with Foxp3+ Treg cell frequencies from patients. (A) The subset of CD14++CD16+ monocytes (CHI) correlated positively with the Foxp3+CD25+CD45RO+ and Foxp3+Helios+CD45RO+ Treg subsets and negatively with the Foxp3+CD25+CD45RA+ and Foxp3+Helios+CD45RA+ subsets; (B) The subset of CD14++CD16+ monocytes (CHI&RPR+) also correlated positively with the Foxp3+CD25+CD45RO+ and Foxp3+Helios+CD45RO+ Treg subsets and negatively with the Foxp3+CD25+CD45RA+ and Foxp3+Helios+CD45RA+ subsets. The blue and red colors represent positive and negative correlations, respectively, between the CD14++CD16+ monocyte subset levels and Foxp3+ Treg cell levels in the CHI and CHI&RPR+ groups. The darker and more saturated the color, the greater the magnitude of the correlation. Correlation matrices were displayed as schematic correlograms (40).

