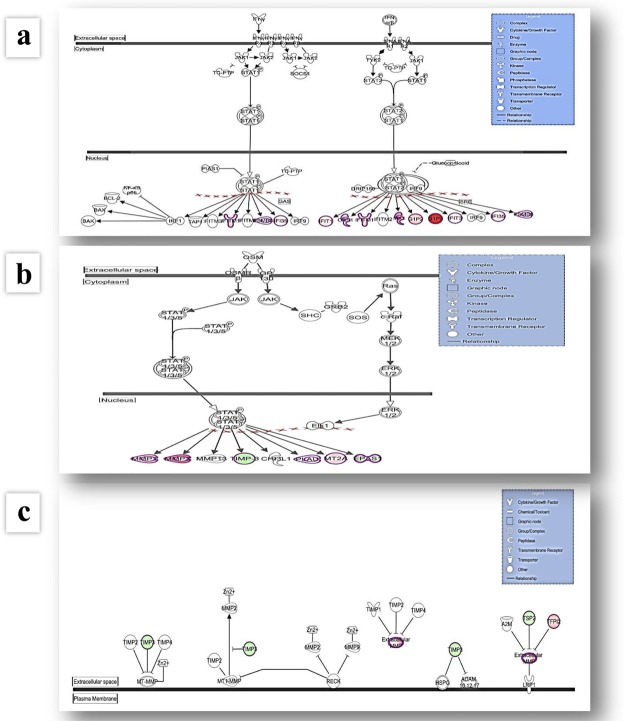
Figure 1.
Graphical representation of the Interferon Signalling (a), Oncostatin M Signalling (b) and Inhibition of Matrix Metalloproteases (c) pathways. The networks were generated through the use of IPA (QIAGEN Inc., https://www.qiagenbio-informatics.com/products/ingenuity-pathway-analysis). Figures represent cellular canonical pathways with most differentially expressed genes after analyses of results obtained for samples of Gaucher patients vs. controls and Gaucher patients vs. Niemann-Pick type C patients. Genes with up-regulated expression are represented in red, while genes with down-regulated expression in green.

