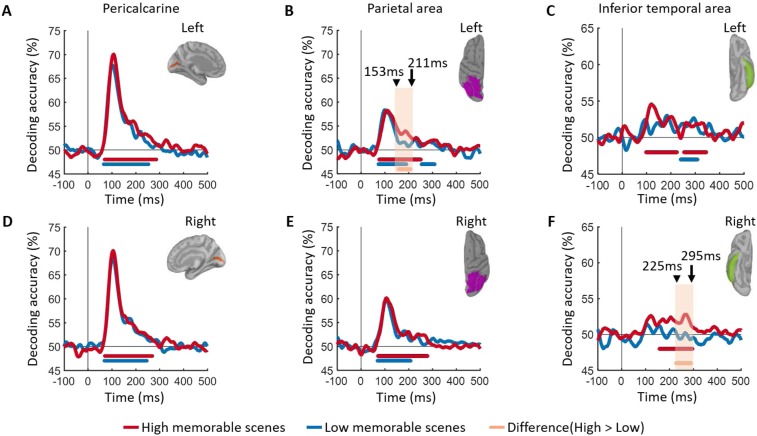
Figure 5.
Spatial localization. (A–F) Time course of image decoding in cortical sources. RDM matrices were extracted at each time point t using MEG source localization in pericalcarine, parietal area and inferior temporal, separately for left and right. The color coded red and blue lines at the bottom of curves show the significant time points where the decoding is above chance level of 50%. The orange line indicates significant time points for the difference between high and low memorability. All significant statistical tests are with permutation tests using cluster defining threshold P < 0.05, and corrected significance level P < 0.05 (n = 15).

