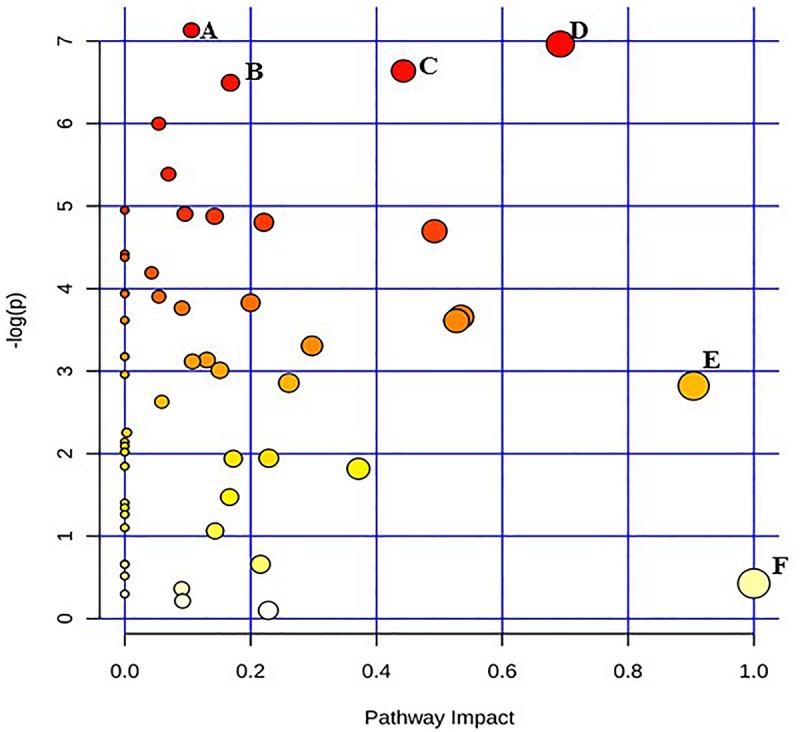
FIGURE 1.

Pathway analysis highlighting important pathways of E. coli O26:H11 immediately after irradiation (EB 0 h) compared to un-irradiated cells (0 kGy Control). The Y axis represents metabolic pathways containing metabolites that are significantly different between treatment groups. They X axis represents the impact these significantly changed metabolites have on the overall pathway based on their position within the pathway. A: Pentose and glucuronate interconversions; B: Pantothenate and CoA biosynthesis; C: Starch and sucrose metabolism; D: Beta alanine; E: Alanine, aspartate, and glutamate metabolism; F: Inositol phosphate metabolism.
