FIGURE 6.

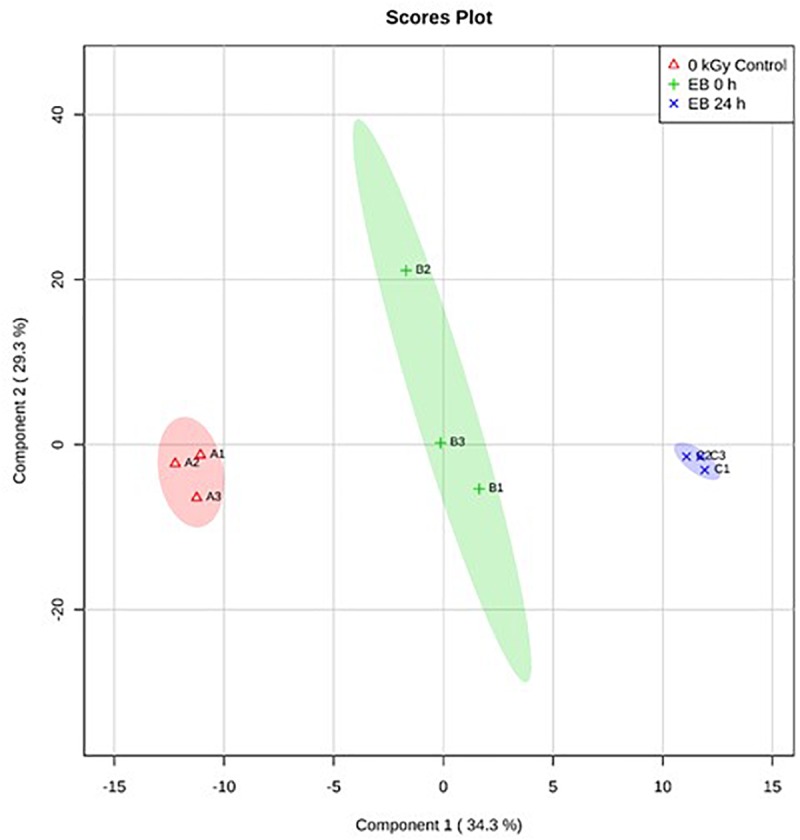
Partial Least Square-Discriminant Analysis (PLS-DA) scores plot showing differences between the un-irradiated (0 kGy Control), irradiated (EB 0 h), and 24 h post irradiation (EB 24 h) S. Typhimurium.

Partial Least Square-Discriminant Analysis (PLS-DA) scores plot showing differences between the un-irradiated (0 kGy Control), irradiated (EB 0 h), and 24 h post irradiation (EB 24 h) S. Typhimurium.