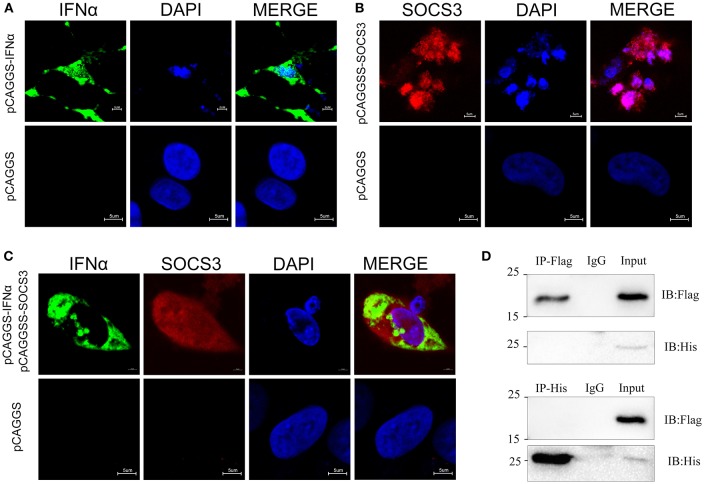
Figure 5.
Subcellular localization of SOCS3 and IFNα. (A) Localization of IFNα (green) in CEFs. DAPI staining shows the nucleus in blue. (B) Localization of SOCS3 (red) in CEFs. DAPI staining shows the nucleus in blue. (C) Co-localization of IFNα (green) and SOCS3 (red) in CEFs. DAPI staining shows the nucleus in blue. (D) CEFs were transfected with pCAGGS-IFNα-Flag and pCAGGS-SOCS3-His for 48 h before the coimmunoprecipitation and immunoblot analysis with the indicated antibodies.

