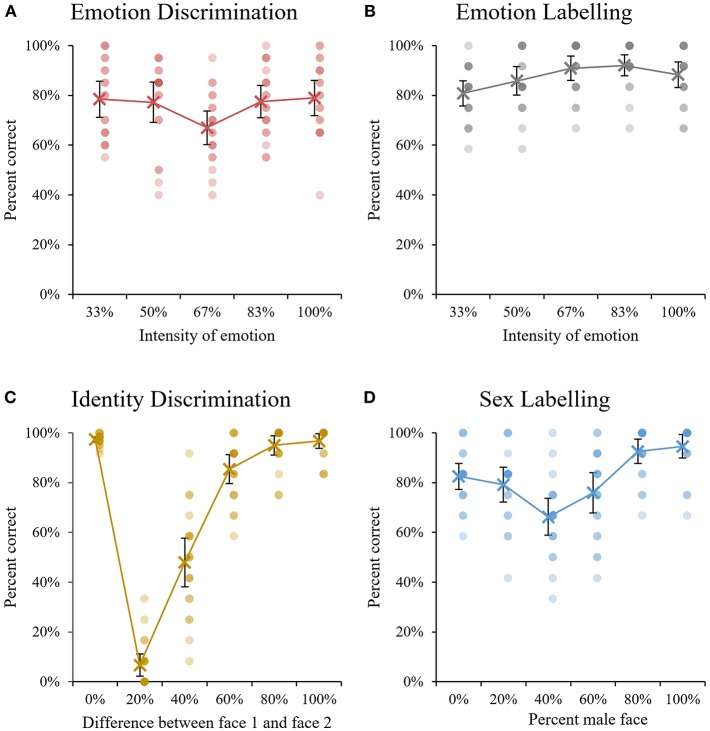
Figure 5.
Mean accuracy performance across the five tasks. For (A,B), emotional intensity is presented on the y axis, where 100% indicates an unedited expression and 50% indicates an expression morphed 50% with a neutral expression. For (C), the x axis indicates the degree of similarity between the two faces presented in each same-or-different pair. For (D), the x axis shows the degree of morphing for each condition, where 40% indicates faces that are a 40/60 morph between a male face and a female face. Error bars indicate 95% confidence intervals around the mean and overlapping dots indicate the performance of individual participants.

