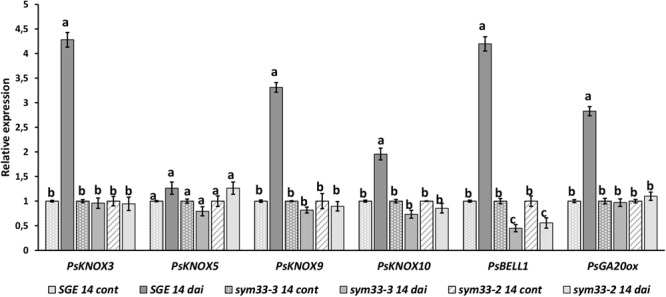
FIGURE 8.

Expression analysis of PsGA20ox, PsKNOX, and PsBELL genes in wild type cv. SGE and SGEFix-–2 (sym33–3), SGEFix-–5 (sym33–2) mutants 2 weeks after inoculation. Transcript levels of genes were normalized against ubiquitin gene. For each gene, the transcript level in non-inoculated roots of wild type or mutants was set to 1 (control), and the level in nodules of wild type or mutants was calculated relative to the control values. Data are averages ± SEM (n = 6–8 plants of wild type or mutant combined from two independent experiments). Values with different letters are significantly different (P < 0.05) as analyzed by one-way ANOVA and the Tukey’s test as post-hoc analysis.
