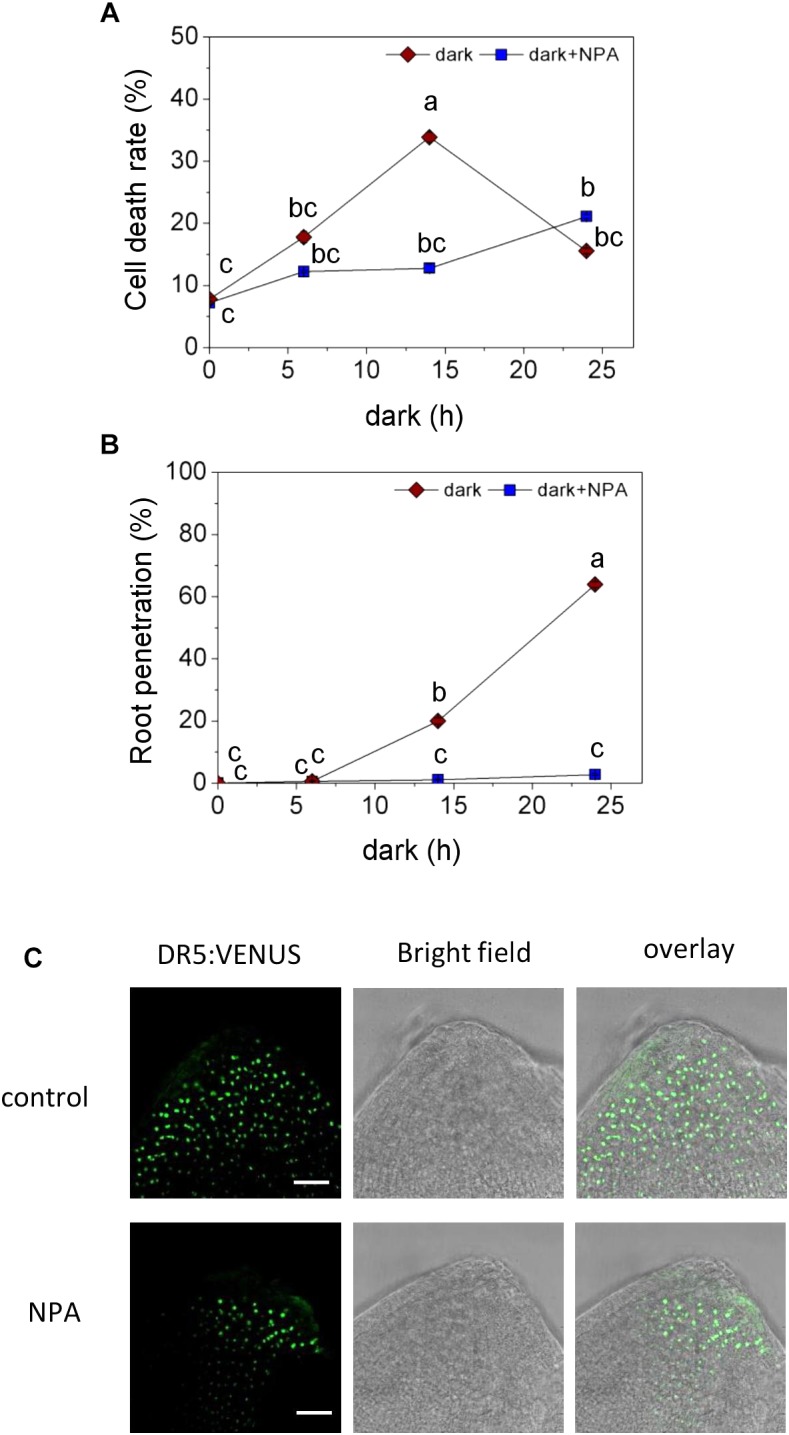
FIGURE 4.

Effect of auxin transport inhibition on programmed cell death (PCD) and AR emergence. (A) Cell death of epidermal cells above AR primordia, analyzed with Evans Blue at the third node of stem sections kept in the dark for 6 h, 14 h or 24 h with or without 5 μM NPA. (B) Percentage of penetrated ARs. Bars in A, B indicate means ( ± SE) of ARs from 9 stems per treatment measured in 3 independent experiments. Different letters indicate statistically significant differences (P < 0.05; ANOVA with Tukey test). (C) Auxin activity detected with DR5:VENUS in AR primordia with or without 5 μM NPA for 1 day; Bar=25 μm.
