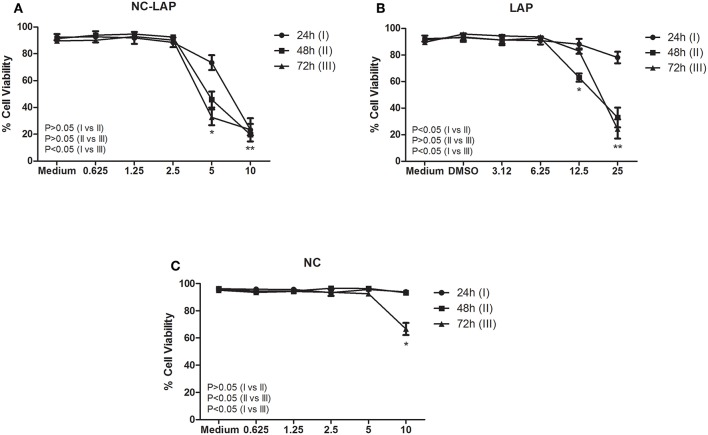
Figure 2.
NC-LAP (A), LAP (B), and NC (C) effect on T24 cells viability assessed by flow cytometry. Cells were treated with Lapatinib (LAP) at concentrations of 3.12, 6.25, 12.5, and 25 μM, with Lapatinib-loaded nanocapsules (NC-LAP) at concentrations of 0.625, 1.25, 2.5, 5, and 10 μM and with relative volume of these concentrations of blank nanocapsules (NC) for 24, 48, and 72 h. The data are expressed as means ± SEM of three independent experiments. Two-way ANOVA with Tukey post-hoc was used to analyze statistical significance. (*) represents the significant difference between the different concentrations. The P-value represents the significant difference between treatment times. The differences were considered significant at P < 0.05.

