Figure 3.
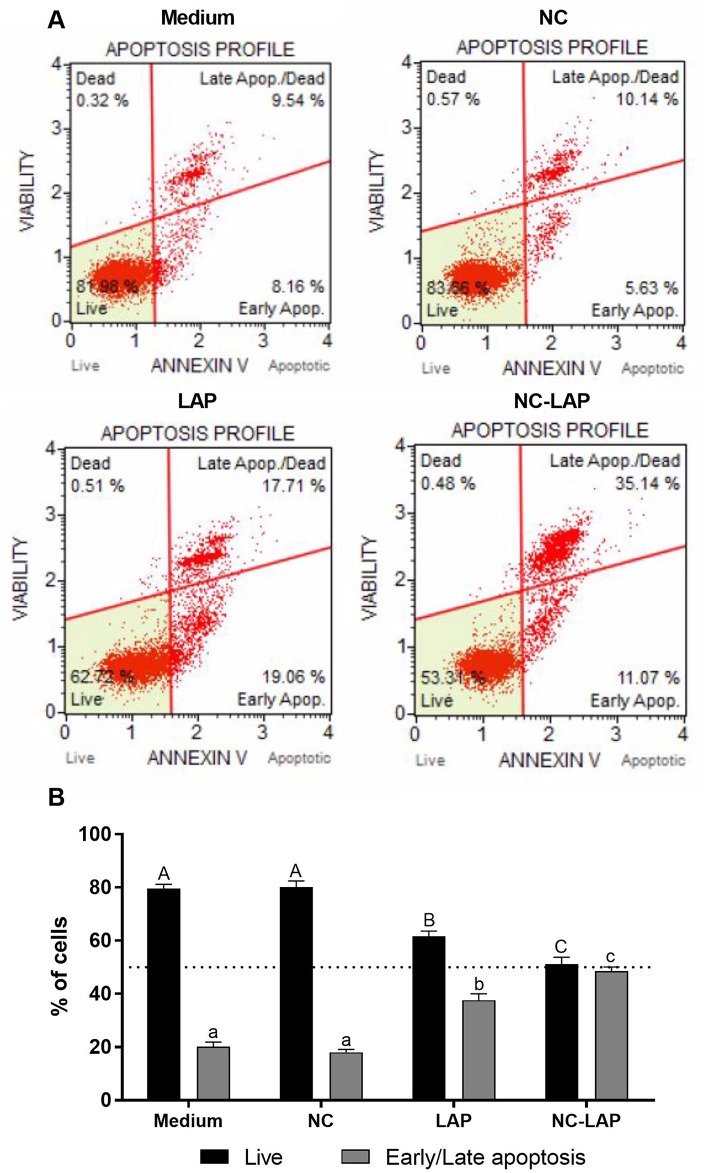
NC-LAP treatment induces apoptosis in T24 cells. T24 cells were incubated with medium (control), LAP or NC-LAP at 5 μM, as well as the relative amount of NC for 48 h. (A) Dot Plot shows the percentage of cell live or early/late apoptosis after each treatment determined by Muse® Annexin V and Dead Cell Assay. Dot Plot Upper: Medium (left side) and NC (right side). Dot Plot Bottom: LAP (left side) and NC-LAP (right side). (B) The graphic represents the expressed data by mean ± SEM with data from three independent experiments. The one-way ANOVA with Tukey post-hoc was used to determine statistical significance. Different capital letters indicate significant differences between means of live cells as well different lowercase letters indicate significant differences between means of cells in early/late apoptosis. Significance was considered at P < 0.05.

