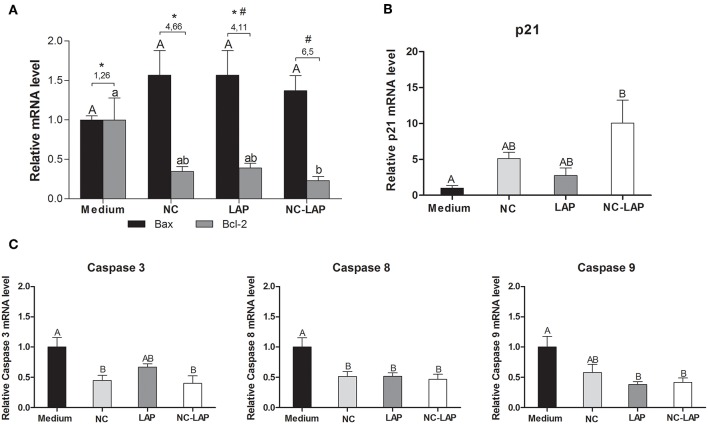
Figure 6.
NC-LAP increased Bax/Bcl-2 ratio and led to up-regulation of p21 in T-24 cell line after 6 h of treatment. The gene expression profile was determined by qRT-PCR and data were normalized using GAPDH levels. (A) Proapoptotic (Bax) and Antiapoptotic (Bcl-2) gene expression. (B) p21 expression gene. (C) Expression levels of caspase 3, 8, and 9 after 6 h. Data are represented by the means ± SEM from three independent experiments. The one-way ANOVA with Tukey post-hoc was used to analyze statistical significance. Significance was considered at P < 0.05. Significance was considered at P < 0.05. Different letters indicate significant differences between the means and different symbols (* and #, asterisk and sharp, respectively) indicates difference in the Bax-Bcl-2 ratio levels between groups.

