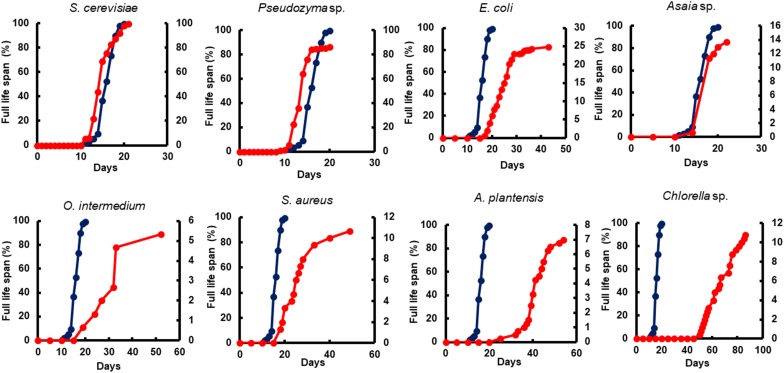
FIGURE 5.
The impact of microorganism-based diets on total life span. A representative life span curve is comparing larvae fed with Tetramin (dark blue line, left y-axis) and larvae fed with microbial cells (red line, right y-axis). The dietary supply was administered only at L1. Survival was assessed daily.

