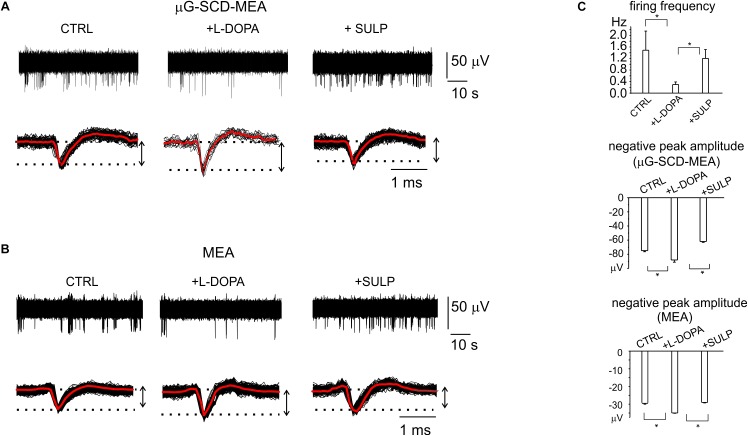
FIGURE 5.
D2-autoreceptor mediated down-regulation of neuronal firing activity measured by μG-SCD-MEAs and MEAs. (A) Representative recordings from one channel of μG-SCD-MEA. Bottom: potentiometric signals from (A) are visualized on an enlarged scale (black traces). Averaged signals are shown in red. (B) Representative recording from one electrode belonging to a conventional MEA, showing the reduction of the firing frequency and its recovery induced by sulpiride. Bottom: individual (black) and averaged signals (red). (C) Top: the bar histograms represent the mean firing frequency in the three conditions (control, with L-DOPA and with L-DOPA+sulpiride), measured by conventional MEAs. Centre, bottom: the bar histogram shows the mean values of the negative peak amplitude and related statistical significance (∗p < 0.05), for μG-SCD-MEAs and MEAs, respectively.

