
Figure 1.
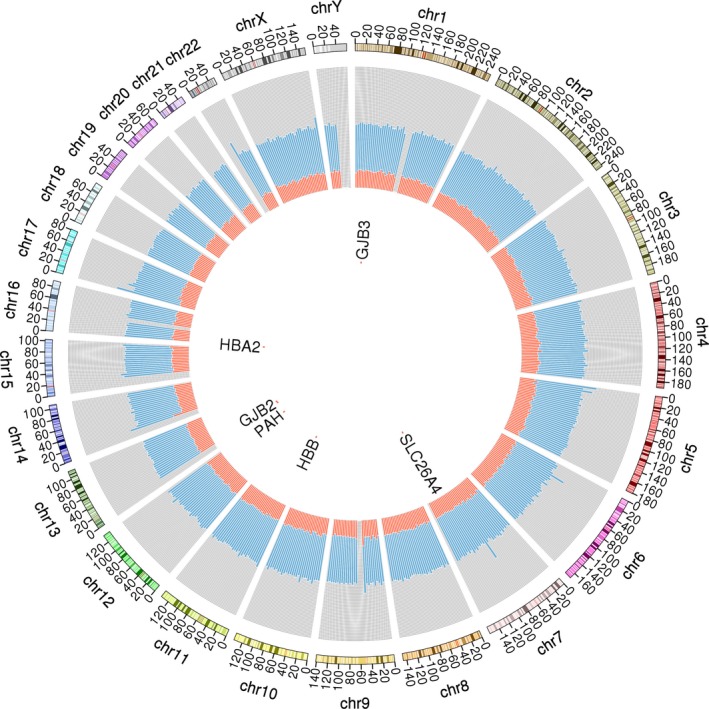
Circos diagram of the target region capture panel. Chromosome ideograms (genome build hg19) are shown in the outmost ring and oriented pter to qter in a clockwise direction. Other tracks, located on the gray background, from inside to outside are the genes tested for the single‐gene disorder, palindrome content (red; range, 0–1), and GC content (light blue; range, 0–1)