
Figure 2.
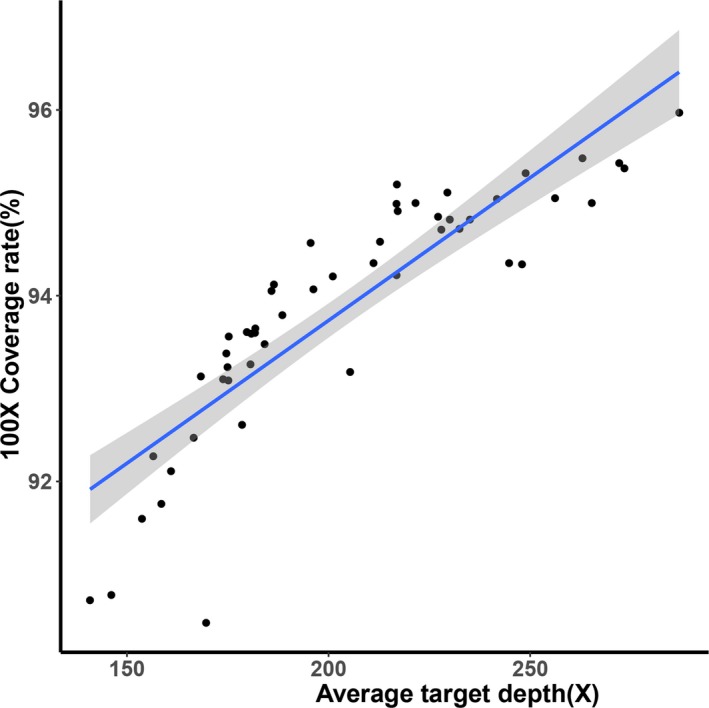
Scatter plot of average target depth against 100× coverage rate in the background database. Unique reads of 22 chromosomes in 68 samples were used to build a standard comprehensive negative background database. The scatter plot showed that the average target depth was in positive correlation with the 100× coverage rate (%). Solid line represents the trend line of linear regression