
Figure 3.
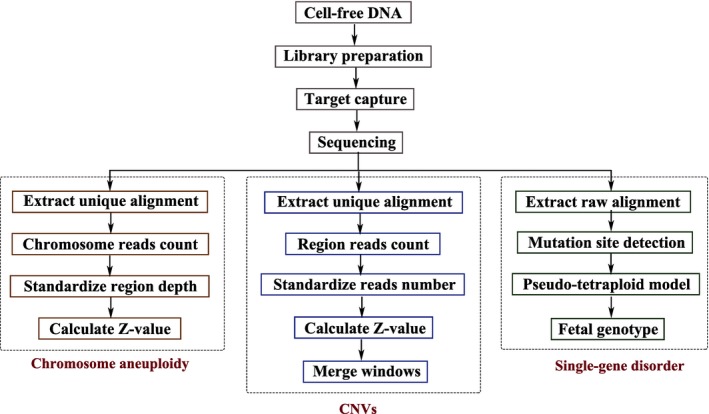
Flowchart of the analysis process. The complete analysis process includes cfDNA extraction, library preparation, target capture, sequencing, and bioinformatics analysis. For chromosomal abnormality and CNV detection process, the number of reads were standardized through comparison with extracted high‐quality unique reads, and Z‐score was then calculated to obtain the results; for the single‐gene disorder detection process, single nucleotide variant (SNV) detection was performed using GATK to compare the unique results. The pseudo‐tetraploid model was used to estimate the best fetal DNA concentration and the best genotype was obtained. Finally, the results were annotated and the corresponding disease loci were identified