Figure 1.

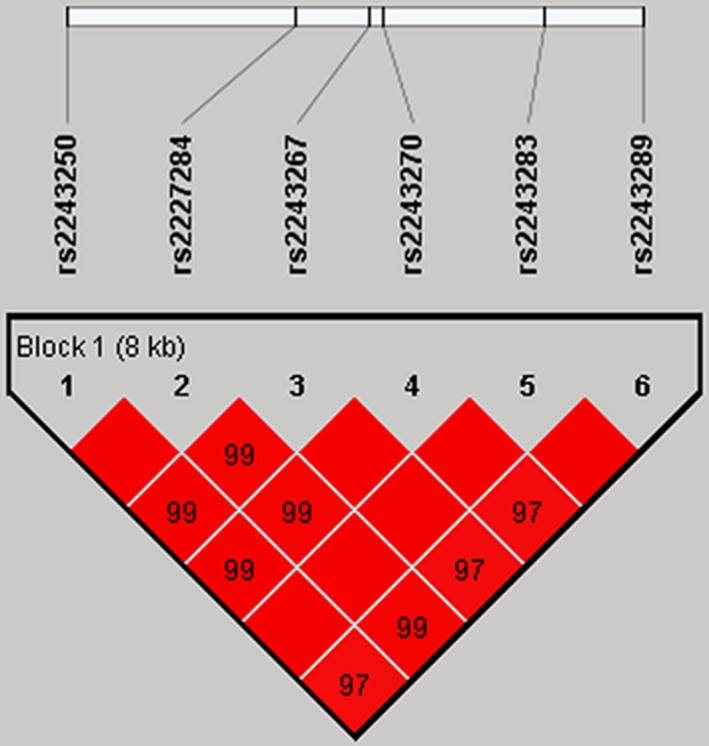
Linkage disequilibrium analysis for six SNPs in the logistic regression model. Standard color schemes indicate different levels of LD. Bright red: LOD > 2, D’ = 1

Linkage disequilibrium analysis for six SNPs in the logistic regression model. Standard color schemes indicate different levels of LD. Bright red: LOD > 2, D’ = 1