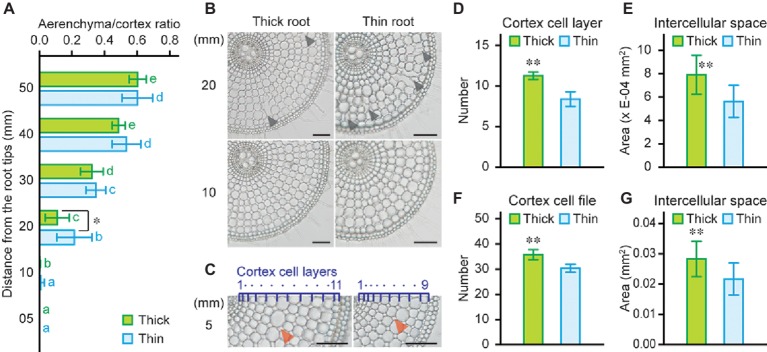
Figure 6.
Intercellular spaces of thick and thin adventitious roots of rice. (A) Ratio of aerenchyma to cortex at 5, 10, 20, 30, 40, and 50 mm from the tips of thick and thin adventitious roots of rice under stagnant conditions. (B) Cross-sections at 10 and 20 mm from the tips of thick and thin adventitious roots under stagnant conditions. Lysigenous aerenchyma is indicated by black arrowheads. Bars = 100 μm. (C) Cross-sections at 5 mm from the tips of thick and thin adventitious roots under stagnant conditions. Cortex cell layers are indicated by dark blue numbers and dots. Intercellular spaces are indicated by red arrowheads. Bars = 100 μm. Number of cortex cell layers (D), area of intercellular spaces (per two cortical cell files) (E), number of cortex cell files at the middle part of cortex cell layers (F), and area of total intercellular spaces (G) at 5 mm from the tips of thick and thin adventitious roots under stagnant conditions. Nine-day-old rice seedlings were further grown under stagnant conditions for 14 days. (A,D–G) Significant differences between thick and thin adventitious roots at p < 0.01 and p < 0.05 (two-sample t-test) are denoted by ∗∗ and ∗, respectively. (A) Different lowercase letters denote significant differences among different positions of roots (p < 0.05, one-way ANOVA and then Tukey’s test for multiple comparisons). Values are means ± SD (n = 8).

