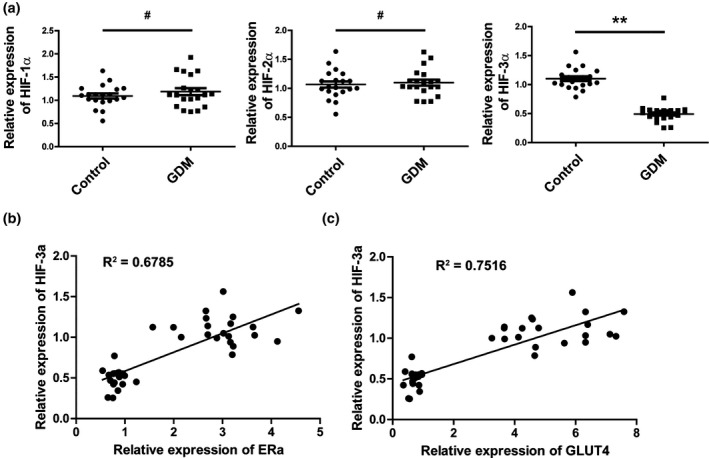
Figure 1.

HIF3A was down‐regulated in the omental tissue from gestational diabetes mellitus patients. (a) Representative scatter plots showing the expression level of HIF1A, HIF2A, and HIF3A in the omental tissue from gestational diabetes mellitus patients and healthy controls. # p > 0.05, **p < 0.01. (b) Spearman's correlation analysis of ESR1 and HIF3A expression levels (R 2 = 0.6785, p < 0.001). (c) Spearman's correlation analysis of SLC2A4 and HIF3A protein levels (R 2 = 0.7516, p < 0.001)
