FIGURE 2.

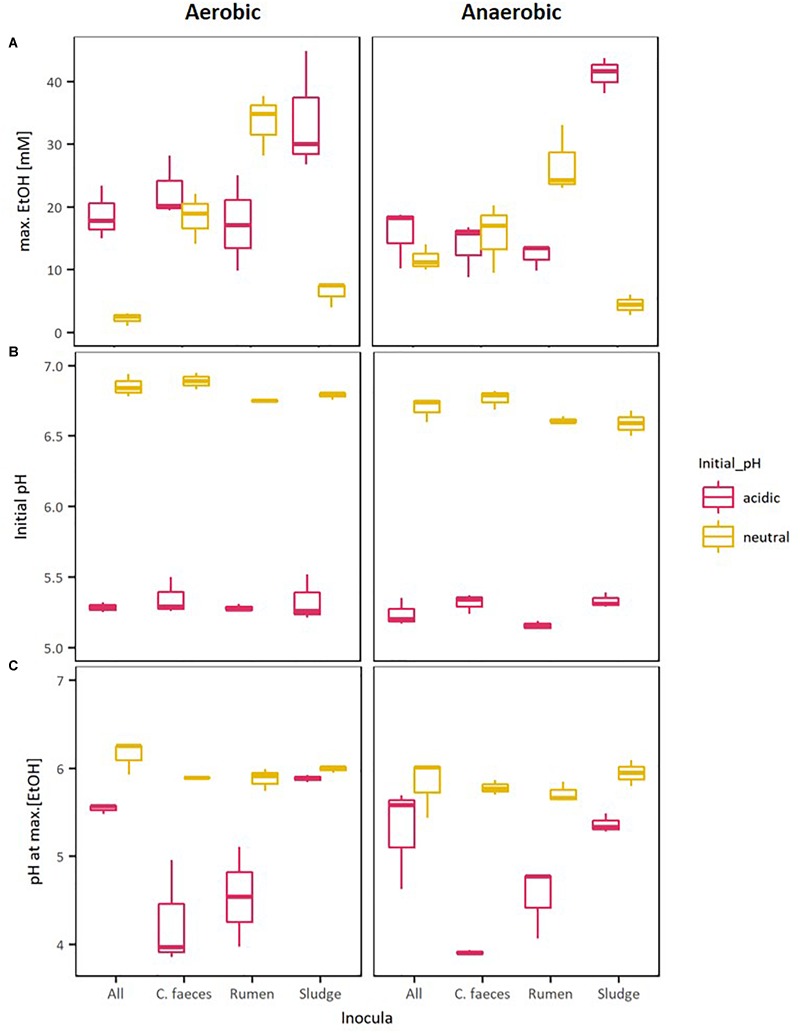
Boxplots of: (A) maximal EtOH production by the different inocula tested in initially acidic and neutral pH, (B) their initial pH, and (C) their pH at max. EtOH concentrations.

Boxplots of: (A) maximal EtOH production by the different inocula tested in initially acidic and neutral pH, (B) their initial pH, and (C) their pH at max. EtOH concentrations.