
FIGURE 3.
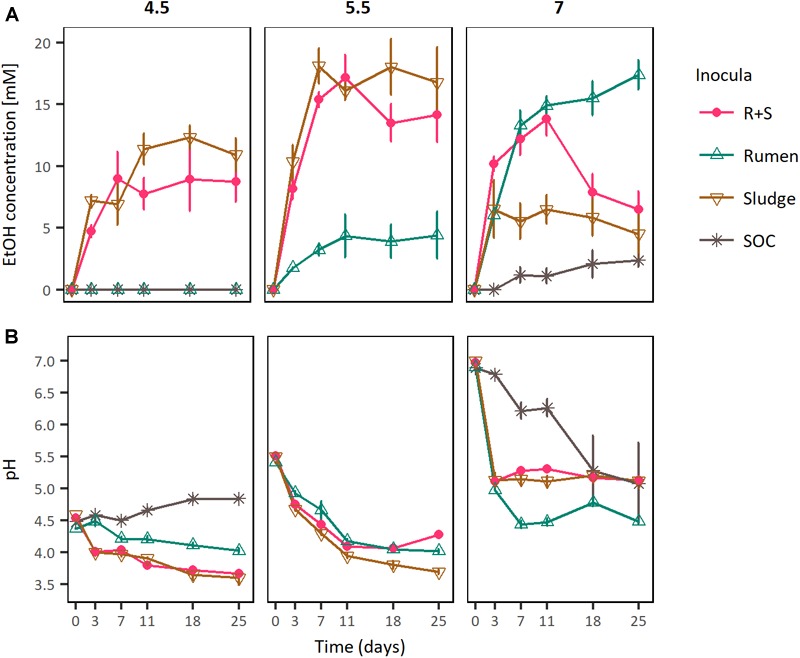
(A) EtOH production profiles and (B) pH curves of rumen, sludge, and R + S incubated at a range of initial pH. SOC, substrate only control at initial neutral pH. The error bars represent the standard error of the mean (SE), n = 3.
Official websites use .gov
A
.gov website belongs to an official
government organization in the United States.
Secure .gov websites use HTTPS
A lock (
) or https:// means you've safely
connected to the .gov website. Share sensitive
information only on official, secure websites.
(A) EtOH production profiles and (B) pH curves of rumen, sludge, and R + S incubated at a range of initial pH. SOC, substrate only control at initial neutral pH. The error bars represent the standard error of the mean (SE), n = 3.