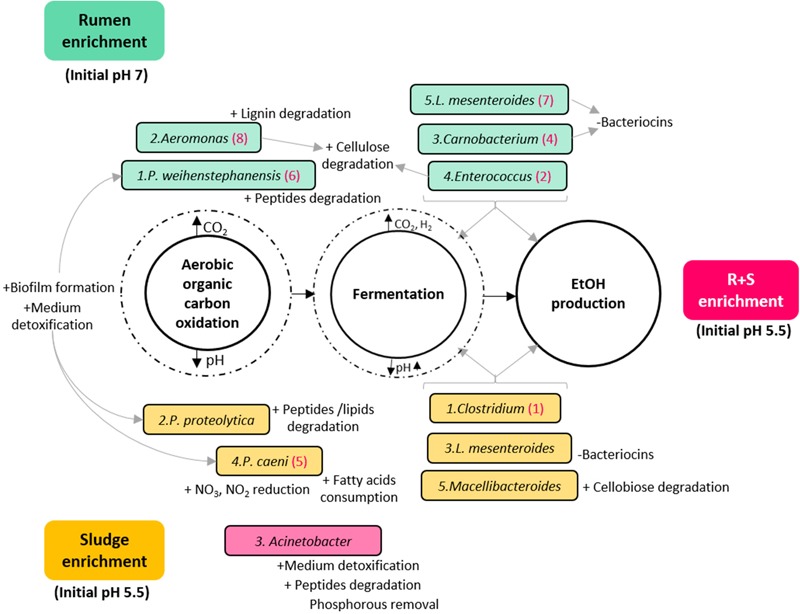
FIGURE 5.

Diagram of the putative functions of the dominant OTUs enriched from the different inocula under study. Turquoise rectangles: rumen enriched. Yellow rectangles: sludge enriched. Pink rectangle: R + S enriched. The numbers before the species name indicate in hierarchical order their contribution to the total relative abundance of their community. Numbers in brackets after the species name, signal OTUs also enriched in the R + S community in hierarchical order of contribution to the total relative abundance for this community. ± symbols before specific OTUs putative functions indicate an activity possibly benefiting (+) or damaging (-) the community.
