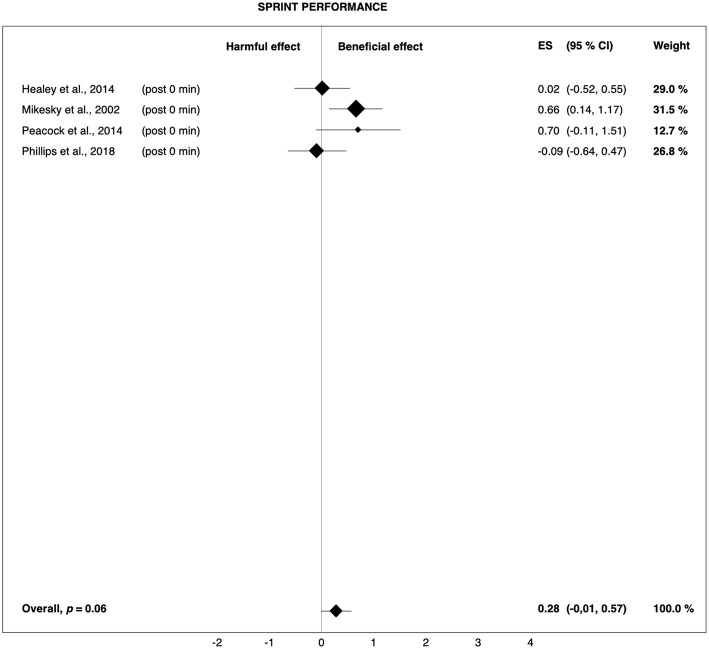
Figure 2.
Forest plot summarizing the effects of pre-rolling on sprint performance. For each study, the timing of the post-test is included in parentheses. The studies are sorted by increasing the duration between the foam rolling intervention and the post-test. The rectangles represent the weighted effect size (ES) and the lines are the 95% confidence intervals (CI). The size of the rectangles indicates the weight of the study.

