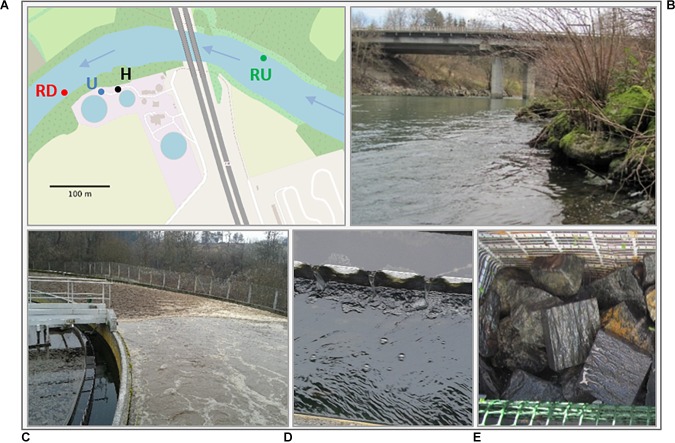
FIGURE 1.
(A) Sampling site map (U, urban treated effluent; H, hospital treated effluent; RU, river upstream; RD, river downstream; WWTP basins are indicated with light-blue circles; approximate sampling locations are labeled with dots in the respective color); (B) sampling location river; (C) WWTP basin; (D) sampling location treated effluent; (E) blueschist stones exposed for biofilm colonization (approximate stone surface: 80 ± 20 cm2).

