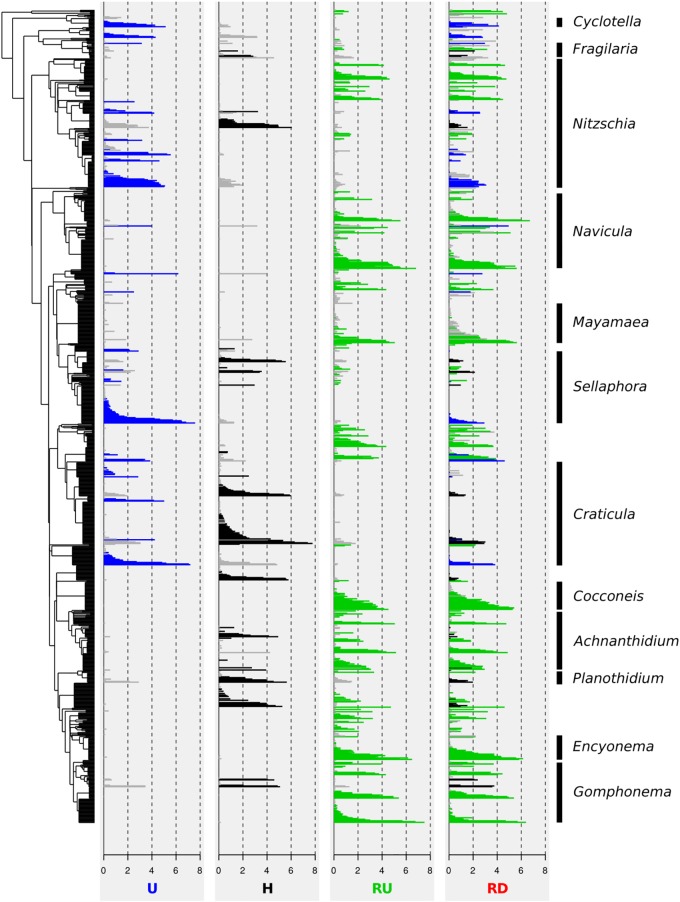
FIGURE 5.
Phylogenetic tree of 1,076 OTUs (log-transformed relative average abundance) of benthic diatoms from urban (U) and hospital (H) treated effluent sites and river sites upstream (RU) and downstream (RD) from the WWTP output. Colors delineate indicator OTUs for each location: U (in blue), H (in black), and RU (in green).

