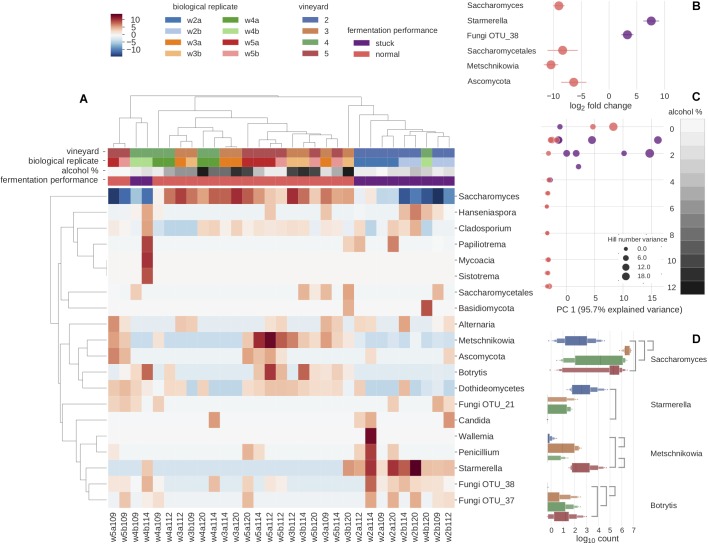
FIGURE 2.
Microbial diversity and predominant genera explain the sample differences using ITS2 metabarcoding. (A) Clustered heatmap depicting the 20 most abundant species. Clustering is mainly driven by fermentation performance. Color scale represents species relative abundances transformed to Poisson dissimilarities. (B) Differential abundance of OTUs in log2 fold change by the fermentation performance: normal fermentation (pink) and stuck fermentation (purple). Four OTUs are found to be significantly more abundantly expressed in normal fermentations, whereas two OTUs are found significantly more abundantly expressed in stuck fermentations. (C) The relationship of alcohol percentage and α-diversity was measured as a first principal component of decomposed Hill numbers with q-values between 0 and 3, for all samples is found to decrease and vary more with rising alcohol percentage. The size of dots increases with the increase in Hill’s number variance. The gray scale corresponds to alcohol percentage. (D) Vineyards were studied with pairwise comparisons of differentially expressed abundances across all time points. Line between vineyards indicates a significant difference between the pairwise comparison.

