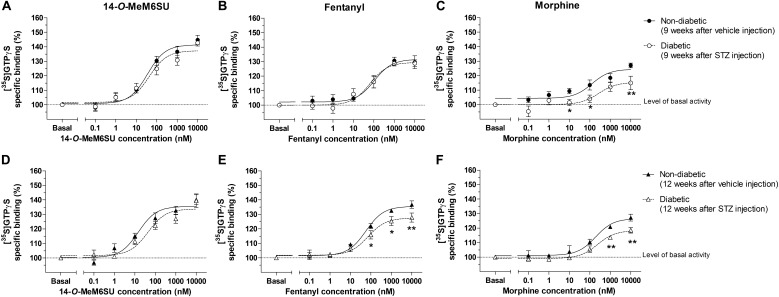
FIGURE 8.
Agonist activity of 14-O-MeMSU (A,D) compared to fentanyl (B,E) and morphine (C,F) in rat whole spinal cord membrane homogenates treated with vehicle or STZ for 9 (A–C) or 12 weeks (D–F) after treatment in [35S]GTPγS binding assays. Figures represents the specific binding of [35S]GTPγS in the presence of increasing concentrations (0.1 nM–10 μM) of the indicated ligands. Points represent means ± S.E.M. for at least three experiments performed in triplicate. “Basal” on the x-axis indicates the basal activity of the monitored G-protein, which is measured in the absence of the compounds and also represents the total specific binding of [35S]GTPγS. The level of basal activity was defined as 100% (indicated by dotted line). The calculated Emax and EC50 ± S.E.M. values are presented in Table 1. ∗p < 0.05 diabetic vs. non-diabetic samples (∗∗p < 0.01; Two-way ANOVA, Fisher’s LSD post hoc test).

