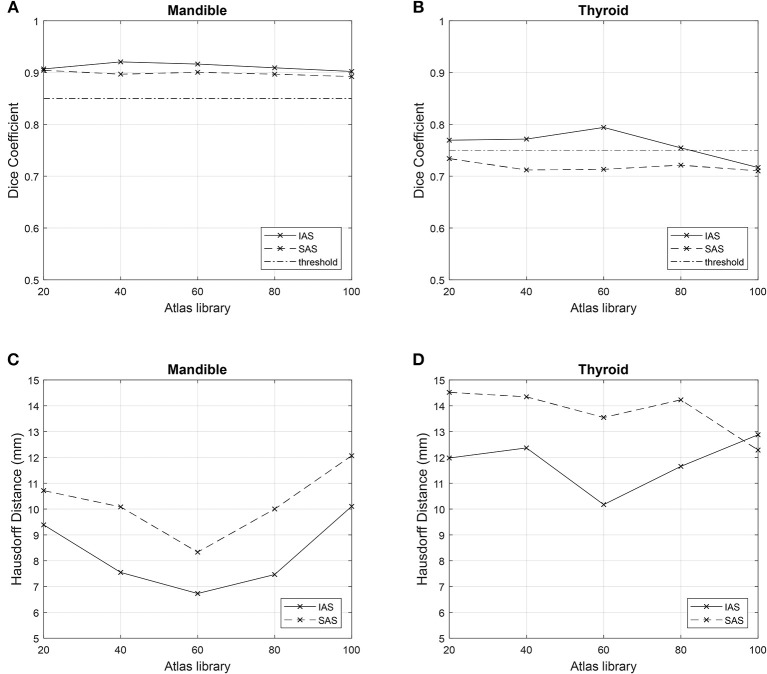
Figure 4.
Comparison of metrics among n atlas groups. Simultaneous atlas segmentation (SAS) is represented as dashed line and independent atlas segmentation (IAS) is represented as bold line. Good overlap limit of 0.75 and 0.85 are represented as straight horizontal lines in (A,B). (A) Mean Dice Similarity Coefficient for mandible. (B) Mean Dice Similarity Coefficient for thyroid. (C) Mean Hausdorff Distance for mandible. (D) Mean Hausdorff Distance for thyroid.

