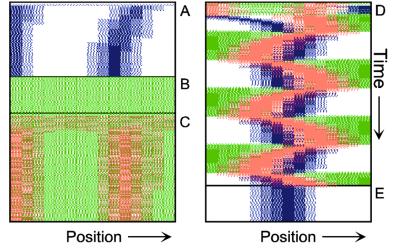
Figure 1.
Components of the center-finding system in E. coli. MinC/D, MinE, and FtsZ are assumed to be pattern-forming systems that assemble in a self-enhancing way on the membrane. In this simulation, the elements are introduced one at a time to show the interplay of the subsystems. Shown is a one-dimensional simulation of patterning at the membrane along the long axis of the cell. Local concentrations are plotted as function of time; concentrations are indicated by the densities of pixels. (A) FtsZ (blue) alone can make a pattern, but the location of the maximum need not be central (σd = 0; σe = 0; μDE = 0). (B) MinD precursor production switched on (σd = 0.0035). MinD (green) on its own does not make a pattern but suppresses FtsZ patterning. (C) MinE precursor production switched on (σe = 0.002). MinE (red) on its own would make a stable pattern. (D) However, because MinE removes MinD from the membrane (μDE = 0.0004) and MinE association depends on MinD, the MinE maximum destabilizes itself and shifts toward a region of higher MinD concentration. Shortly before the MinE wave reaches the pole, MinD and MinE concentrations collapse. On its way, the MinE wave removes MinD from the membrane. Meanwhile, a new plateau of membrane-bound MinD is rising in the other part of the cell. A new high MinE concentration is triggered at its flank, causing this peak to disappear also, leading to a polar MinD oscillation in counter phase. Because of the low MinC/D level at the center, the FtsZ signal for septum formation appears there. (E) FtsZ remains in place there even after switching off of MinD (σd = 0). MinE disappears from the membrane, although the precursor is still produced. Eight hundred iterations are calculated between each pixel row; 80,000 time steps (iterations) are required for one full cycle. The total region has been subdivided into 15 spatial units. Assuming a length of E. coli of 3 μm and a full cycle of 50 s, the spatial unit size equals ≈0.15 μm, and one iteration corresponds to 0.6 ms.

