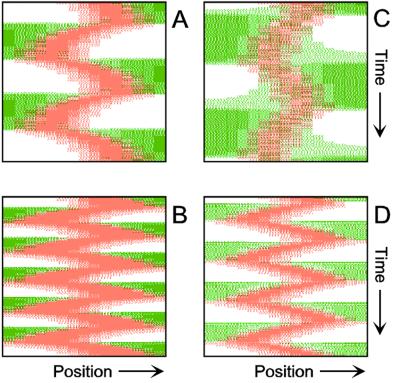
Figure 4.
Inverse relationship of the MinD and MinE concentrations on oscillation frequency. (A) “Normal” pattern. (B) An increase of the MinE precursor production (σe from 0.002 to 0.004) leads to a higher oscillation frequency, because less time is required to remove MinD. (C) Conversely, a decrease (σe = 0.001) leads to a lower frequency (note that the MinE wave does not have to reach a pole before MinD can trigger at the opposite pole). (D) The lowering of MinD precursor synthesis (σd from 0.0035 to 0.002) leads to more rapid oscillations, because less MinD has to be removed from the membrane. All simulations start with identical initial situations.

