Figure 8.
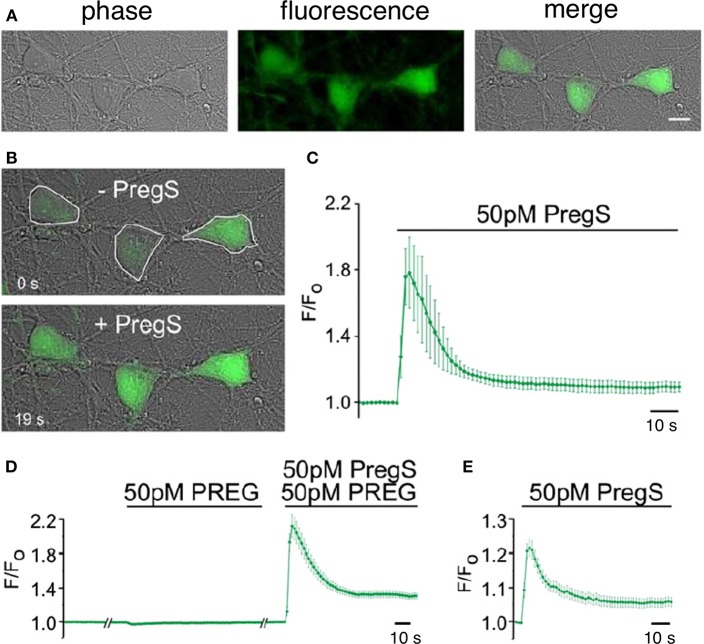
Picomolar concentrations of PregS increase [Ca2+]i in primary cultured cortical neurons. (A) Phase-contrast (left), fluorescence (middle), and merged (right) image of a field of cortical neurons. (B) Before (top, 0 s) and after (bottom, 19 s) application of 50 pM PregS. Regions of interest defined morphologically as neuronal cell bodies are outlined in white. (C) Mean 6 S.E.M. fluorescence intensity normalized to average initial intensity of the same cell (F/Fo) for 3 neurons in (B). (D) Baseline Ca2+ fluorescence is shown in the (left) trace. PREG (50 pM) does not increase [Ca2+]I (middle trace), whereas a subsequent application of 50 pM PregS in the presence of 50 pM PREG increases [Ca2+]i. (right trace) (mean 6 S.E.M., 30 neurons). (E) 50 pM PregS increases [Ca2+]i in primary cultured hippocampal neurons. Scale bar for (A,B): 10 mm. [From Smith et al. (48) with Permission].

