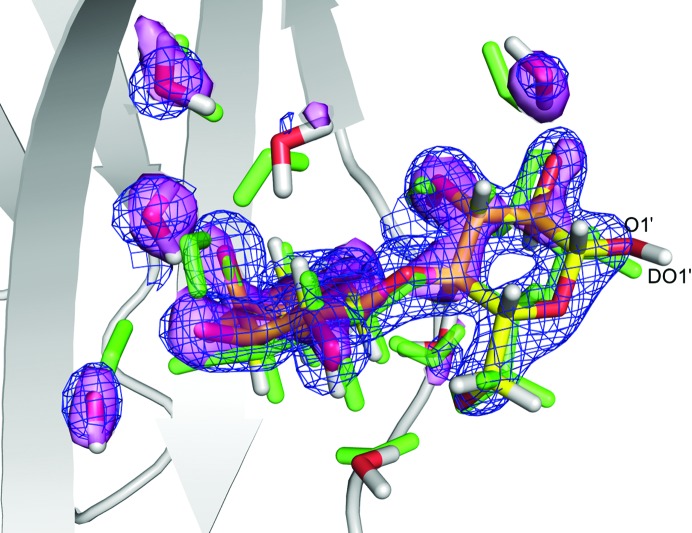
Figure 7.
Positions of lactose and the water molecules in QM/MM structures optimized without (w X = w N = 0, green) or with restraints to the crystallographic data (w N = 1, w X = 3). The 2m|F o| − D|F c| electron density at 1.0σ is shown as a blue grid and the nuclear 2m|F o| − D|F c| density at 1.0σ is shown as a violet surface.

