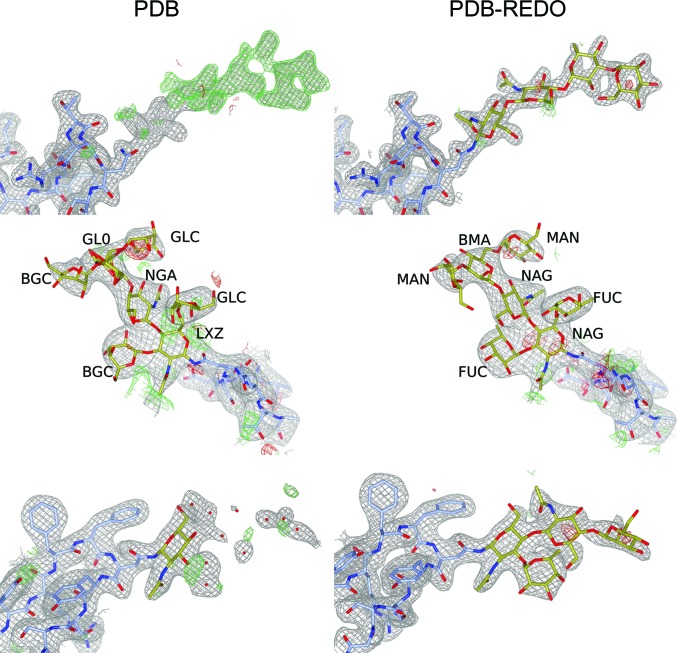
Figure 3.
Carbohydrate remodeling: a comparison between PDB (left) and PDB-REDO (right). Top: new glycosylation-tree modeling at AsnA24 in PDB entry 2aaa (Boel et al., 1990 ▸). Clear difference density is visible at this asparagine, which follows the glycosylation sequence motif. After flipping the side chain of AsnA24, four carbohydrate residues can be built at this position; there is also partial density for a fifth mannose, but this was not built. Middle: glycosylation-tree rebuilding at AsnA529 in PDB entry 3d12 (Xu et al., 2008 ▸). The seven carbohydrate moieties in the PDB entry (and indicated in the figure) are carbohydrate residues that are not commonly found in N-glycosylation, which can now be replaced automatically with the correct residues. It may be possible that the wrong residue names have arisen as an unwanted side effect from PDB remediation efforts (Henrick et al., 2008 ▸). The residues for which the abbreviations have not been defined (LXZ, NGA and GL0) are similar to NAG, NAG and GAL, respectively, but with one or more inverted chiral centers. Bottom: glycosylation-tree extension at AsnC81 in PDB entry 6g46 (Hussein et al., 2018 ▸). Three residues could be added at this position, which was enabled partly because of improved refinement in PDB-REDO (R free decreased from 23.1% to 21.5%). Ten water molecules were deleted. In all cases, amino acids are shown in blue and carbohydrate residues in gold. For sake of clarity, the 2mF o − DF c map is contoured at 1.2σ (top), 1.5σ (middle) and 1.0σ (bottom). The mF o − DF c map is shown at 3.0σ in all cases. CCP4mg (McNicholas et al., 2011 ▸) was used to generate this figure.

