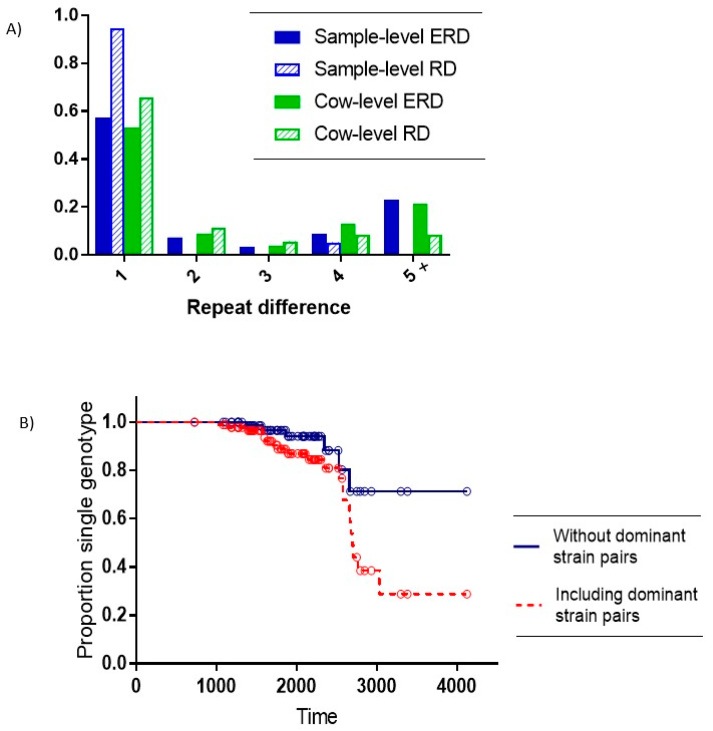
Figure 3.
Distinguishing multiple infections from within-host evolution. (A) Juxtaposes the Expected Repeat Difference (ERD) based upon random pairs of single-SSR type samples with the observed Repeat Difference (RD) for within-host pairs with multiple SSR types. Solid bars represent ERD and striped bars represent RD. Sample-level results are presented in blue and cow level results in green. The X axis shows repeat differences of 1, 2, 3, 4, and 5 or more. The Y-axis indicates the proportion of samples. The four samples with ‘mixed’ designation are not included in this figure. (B) Kaplan–Meier plot of time in days to mutation event in animals with at least one SSR type initially detected. The red dashed line includes dominant on-farm SSR pairs, while the solid blue line does not.

