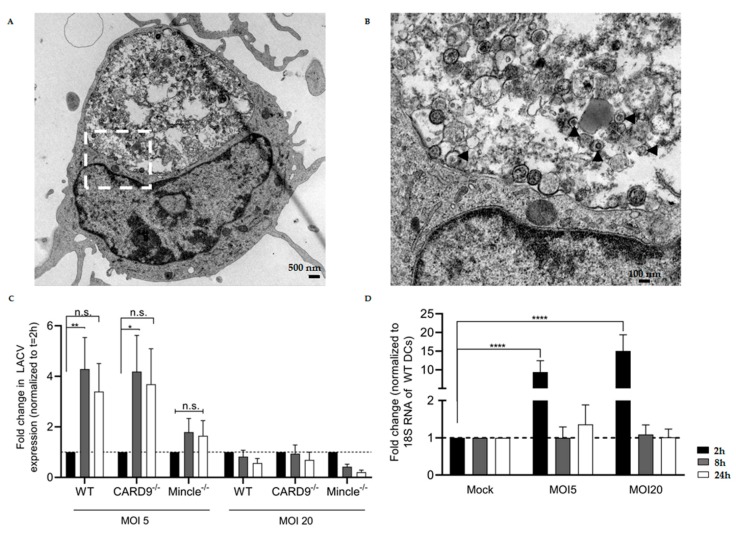
Figure 3.
LACV internalization, replication in Mincle−/−, CARD9−/−, or WT dendritic cells (DCs), and LACV-dependent induction of Mincle expression. (A) Transmission electron microscopy (TEM) picture showing a LACV-infected WT DC at time 2 h (magnification 6300×). (B) Close-up TEM picture (magnification 25,000×) of highlighted region in (A). The black arrowheads show LACV particles inside vesicles in the phagolysosome. (C) Expression levels of LACV N mRNA at different time points in DCs. The time point 2 h was used as baseline (internalized LACV). In C, two distinct LACV MOI were used—MOI 5 and MOI 20. (D) Expression levels of Mincle mRNA at different time points in LACV-infected WT DCs. The mock-infected DCs were used as baseline. Data shown in (C) and (D) are mean ± SEM and three independent experiments were performed. A two-way ANOVA with a Tukey’s honest significance test was used to compare differences between the different groups and p < 0.05 was considered significant (* p < 0.05, ** p < 0.01, *** p < 0.001, **** p < 0.0001).

