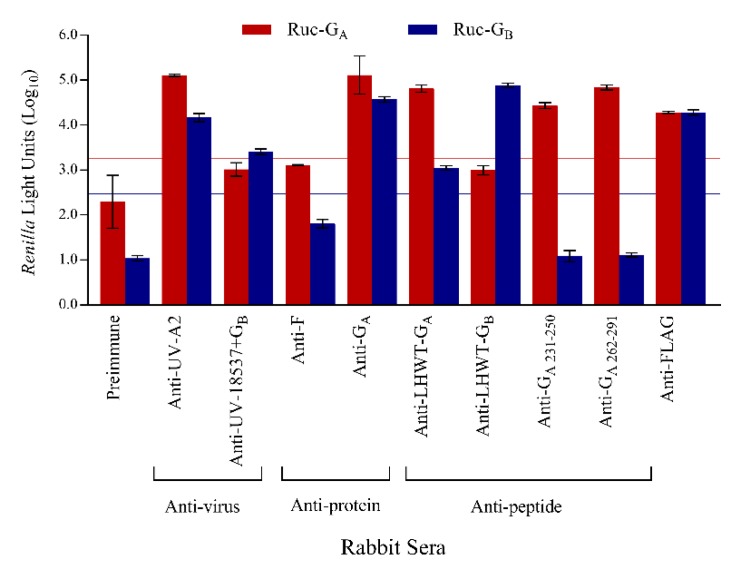
Figure 3.
Specificity of the LIPS-G assays. Specificity of RSV LIPS-G assays was also shown using rabbit antisera. Mean reactivities against Ruc-GA and Ruc-GB antigens are shown in red and blue bars, respectively, and error bars represent standard deviations. Data were normalized against rabbit anti-FLAG antibody. Cutoff values for a positive signal were five standard deviations above the mean value of the negative control and are shown as horizontal red (Ruc-GA) and blue lines (Ruc-GB).

