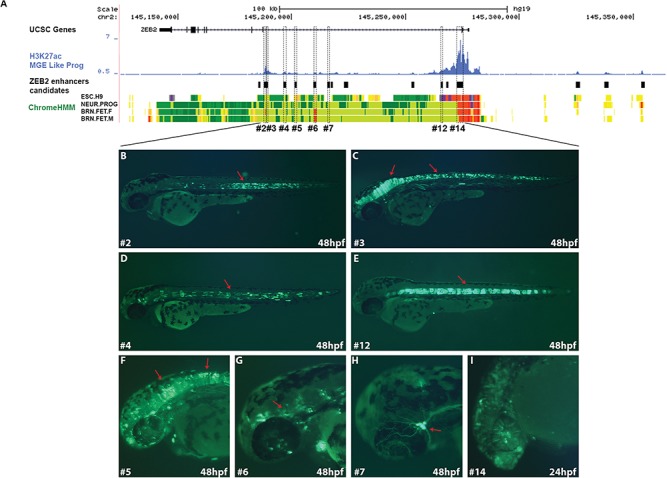
Figure 2.

In vivo functional enhancers in the ZEB2 locus. (A) UCSC Genome Browser (http://genome.ucsc.edu) tracks represent UCSC genes, H3K27ac ChIP-seq peaks of human interneuron progenitors, selected enhancer candidates and chrome ImputedHMM track from roadmap displays chromatin state segmentation for H1 and H9 ESC-derived neurons and human fetal brain (female and male). Black boxes represent enhancer candidates that were tested in zebrafish. Dashed rectangles represent positive enhancers in zebrafish. (B–J) Tissue-specific enhancers in zebrafish embryos at 24 and 48 hpf reflected by GFP expression in the (B) notochord (ZEB2#e2), (C) mid/hindbrain and spinal cord (ZEB2#e3), (D and E) notochord (ZEB2#e4 and 12), (F) mid/hindbrain and spinal cord (ZEB2#e5), (G and H) specific neurons with morphology-like trigeminal ganglia (ZEB2#e6 and 7) and (I) CNS (ZEB2#e14).
