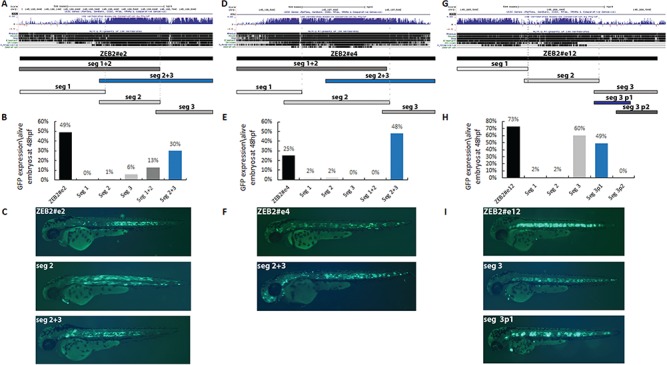
Figure 3.

Segmental analysis of the three notochord enhancers: ZEB2#e2, 4 and 12, in zebrafish embryo at 48 hpf. (A–C) Segmental analysis of ZEB2#e2 that was divided into three overlapping segments (segments 1–3). (A) UCSC Genome Browser conservation track (http://genome.ucsc.edu). (B) A graph displaying the number of embryos showing GFP expression in the notochord out of all live embryos at 48 hpf. (C) Zebrafish enhancer assays for ZEB2#e2 segments show notochord GFP expression (and in somitic muscles) for the entire ChIP-seq peak, somitic muscle GFP expression for segment 2 and notochord and somitic muscle GFP expression for segment 2+3 (no GFP expression for segments 1, 3 or 1+2). (D–F) Segmental analysis of ZEB2#e4 that was divided into three overlapping segments (segments 1–3). (D) UCSC Genome Browser conservation track (http://genome.ucsc.edu). (E) A graph displaying the number of embryos showing GFP expression in the notochord out of live embryos at 48 hpf. (F) Zebrafish enhancer assays for ZEB2#e4 segments show notochord GFP expression for the entire ChIP-seq peak and notochord GFP expression with segment 2+3 (no GFP expression with segments 1, 2, 3 and 1+2). (G–I) Segmental analysis of ZEB2#e12 that was divided into three overlapping segments (segments 1–3), with segment 3 being further divided into additional two parts (3p1 and 3p2). (G) UCSC Genome Browser conservation track (http://genome.ucsc.edu). (H) A graph displaying the number of embryos showing GFP expression in the notochord out of all live embryos at 48 hpf. (I) Zebrafish enhancer assays for ZEB2#e12 segments show notochord GFP expression for the entire ChIP-seq peak and notochord GFP expression with segments 3 and 3p1 (no GFP expression with segments 1, 2, 3 and 3p2).
